


U.S. stocks are facing fresh pressure as new tariffs, rising oil prices and higher Treasury yields increase the uncertainty across financial markets. The Dow Jones Industrial Average and S&P 500 closed lower last week as investors reacted to inflation risks and the weak sentiment toward major technology stocks. The new U.S. tariffs may add another layer of uncertainty but the immediate impact of tariffs could remain limited as many products are exempt and several countries face similar tariff levels.
U.S. Tariffs Increase Inflation Risks for Wall Street
The Trump administration imposes new 10% and 12.5% tariffs on products from 60 trading partners. The measures come into effect as the temporary 10% tariff imposed on the world expires. Nearly all U.S. imports are subject to the new duties, with some key categories of imports exempt. These include oil and gas, fertilizer, certain food products, aircraft and certain critical minerals and goods already covered by other national security tariffs.
It could have a more muted effect on the U.S. stock market than the headline would indicate. The tariffs were widely expected and for several countries the existing tariff possibilities will remain largely unchanged. The European Union also reported that the measures do not exceed the previously agreed tariff ceilings. This reduces the immediate trade shock risks.
But the impact will be more significant depending on the way businesses cope with the increased import prices. Companies with a high dependence on imported components may be under pressure for margins. Some companies may pass these costs to consumers. This would raise inflation risks and make it more problematic for the Federal Reserve to consider easy monetary policy.
Therefore, tariffs would likely affect the stock market primarily through their impact on inflation expectations and corporate earnings but not due to an immediate decline in trade. Investors will also be looking for retaliation from key trading partners. A more muted reaction would add less pressure to the market, but a bigger trade dispute would add more volatility and weaken risk appetite.
Dow Jones Price Forecast
Every new Dow Jones analysis as it publishes, today's technical signal and key levels, live price — on one page.
See all Dow Jones forecastsOil Prices and Treasury Yields Pressure U.S. Stocks
The biggest short term threat to Wall Street is the surging oil prices. Brent crude closed above $98 per barrel and WTI oil has broken the $90. The escalation in the Middle East conflict has led to concerns about the availability of energy worldwide. When oil prices increase, the transportation and production costs across the economy increase and may lead to higher rate of inflation.
The 10-year US Treasury yields have moved to the highest levels since early 2025. The higher yields increase the borrowing costs and reduce the relative appeal of expensive stocks. This pressure is especially high for firms that rely significantly on their future earnings growth.
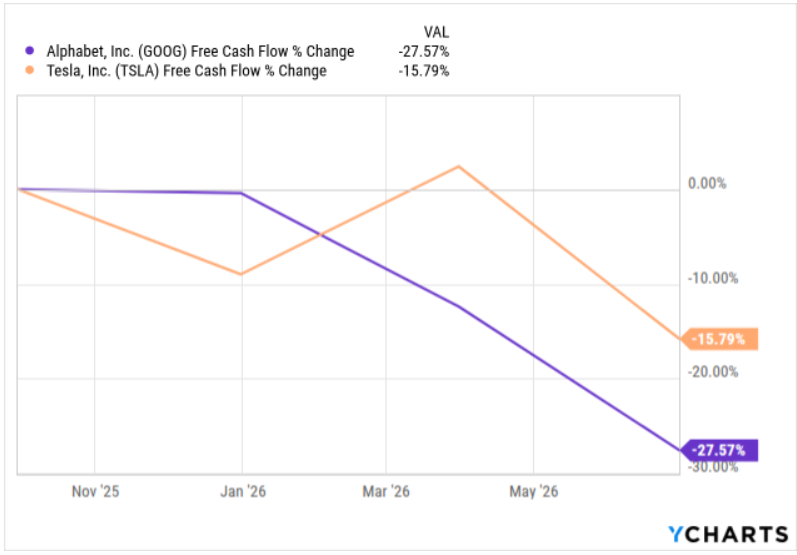
The corporate earnings also did not offer much support. Alphabet Inc. (GOOGL) and Tesla Inc. (TSLA) dropped as investors paid attention to spending plans and negative free cash flows. The chart below shows that the free cash flows of Alphabet and Tesla have decreased by 15.79% and 27.57% over the past year.
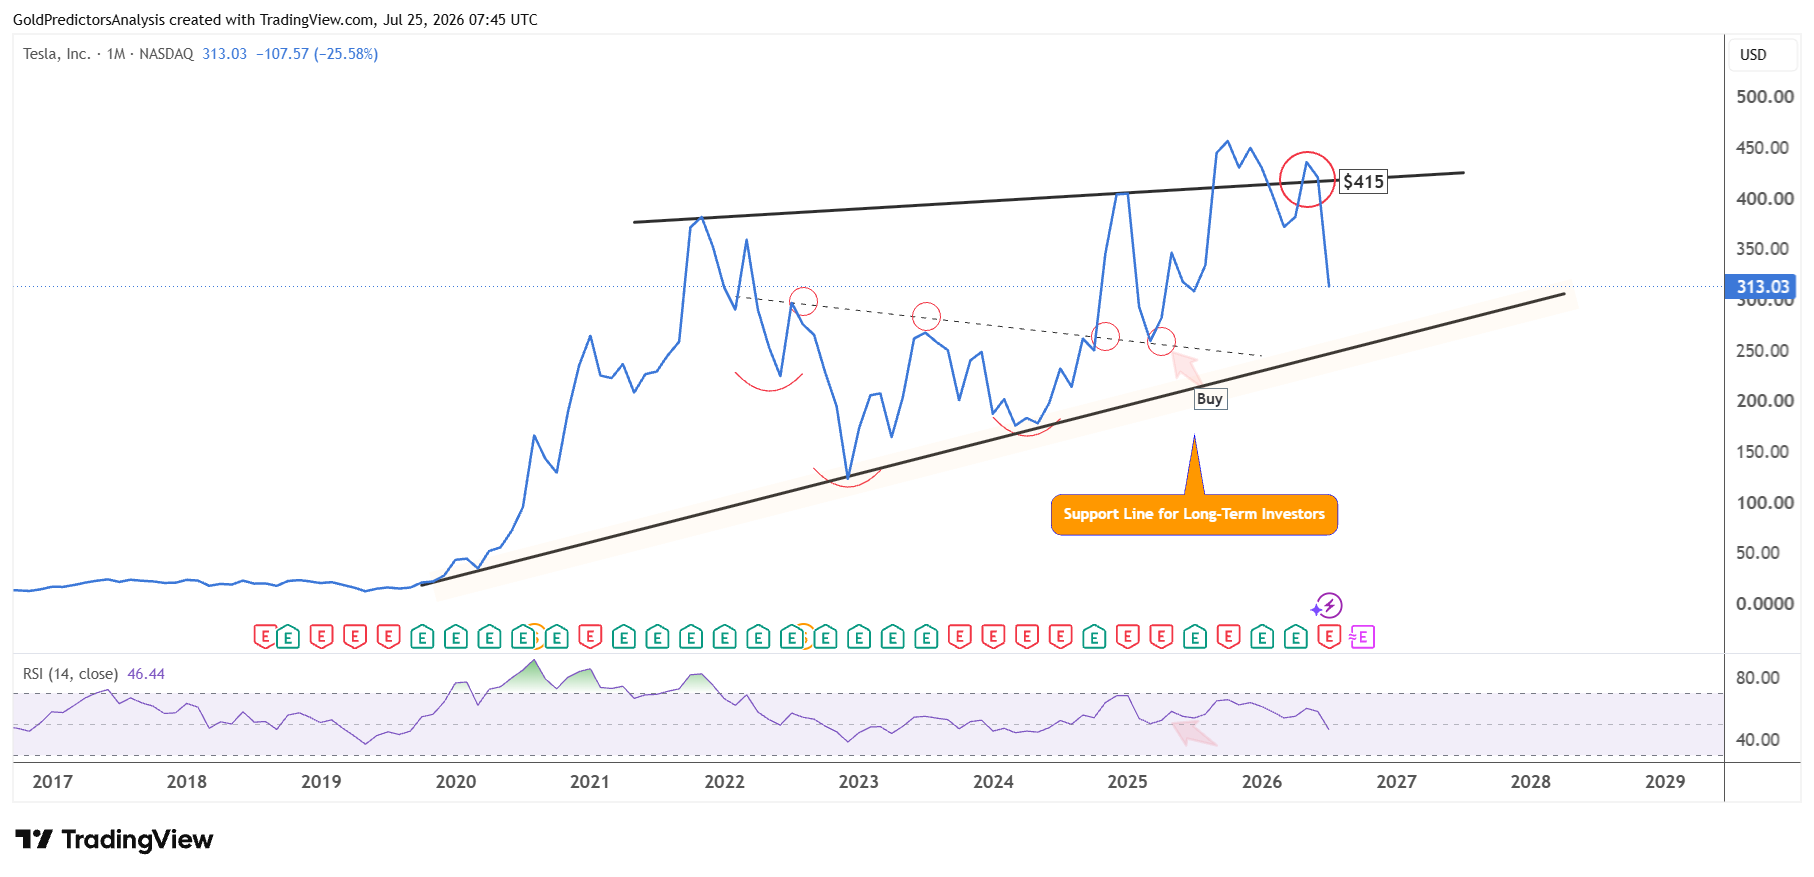
The stock price of Tesla dropped by 17.81% last week to close at $313.03. This drop was developed at the technical resistance level that is defined by the triangle pattern.
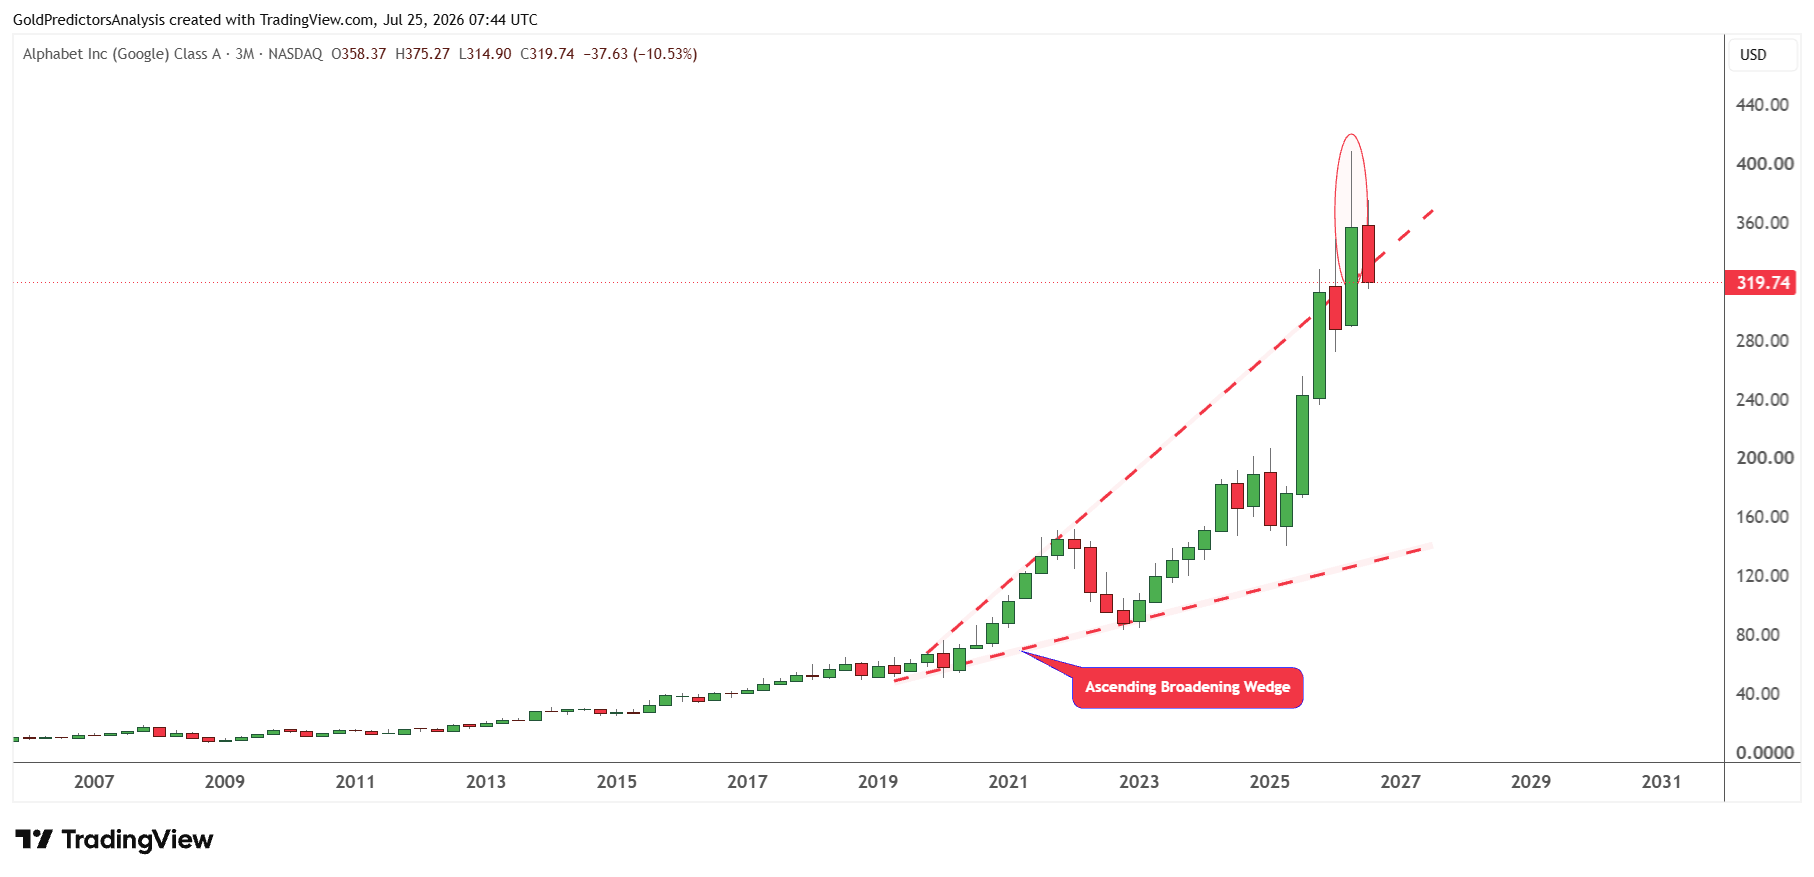
Similarly, the Alphabet also dropped by 10.53% and closed the week at $319.74. This drop was aligned with the extremely overbought conditions above the ascending broadening wedge pattern. The market needs to stabilize before continuing further higher.
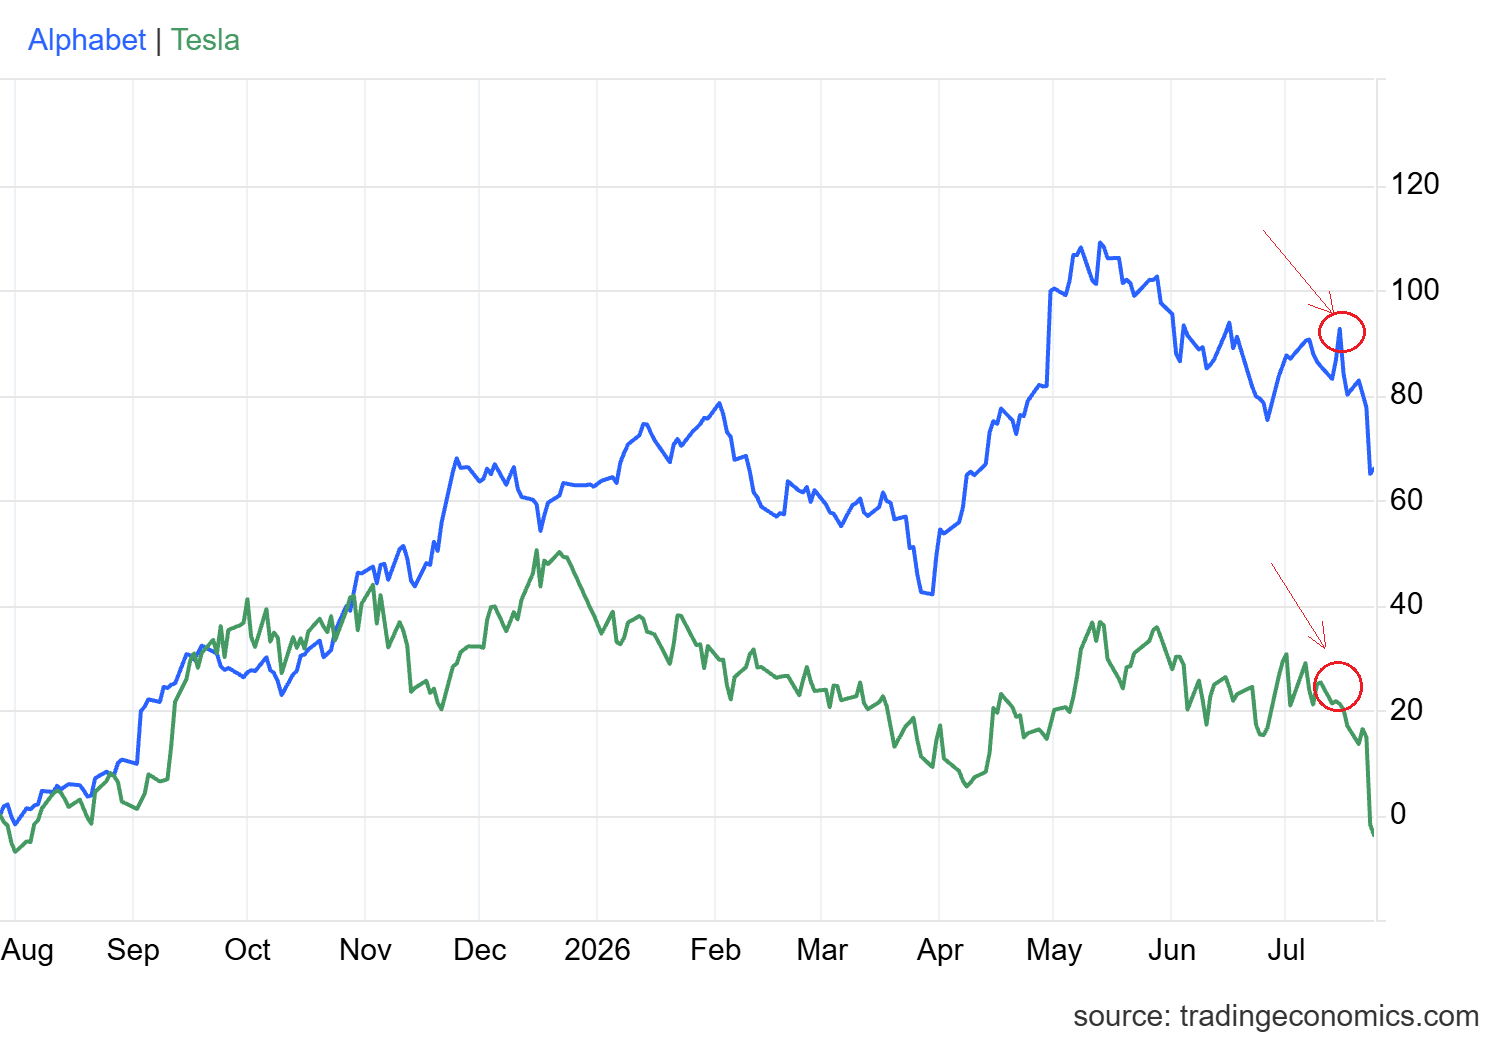
The reaction was extreme and it shows that investors are no longer willing to ignore the poor spots in the companies’ earnings.
The number of stocks that fell was far greater than number that rose on the New York Stock Exchange. The VIX also closed up as investors grew more defensive.
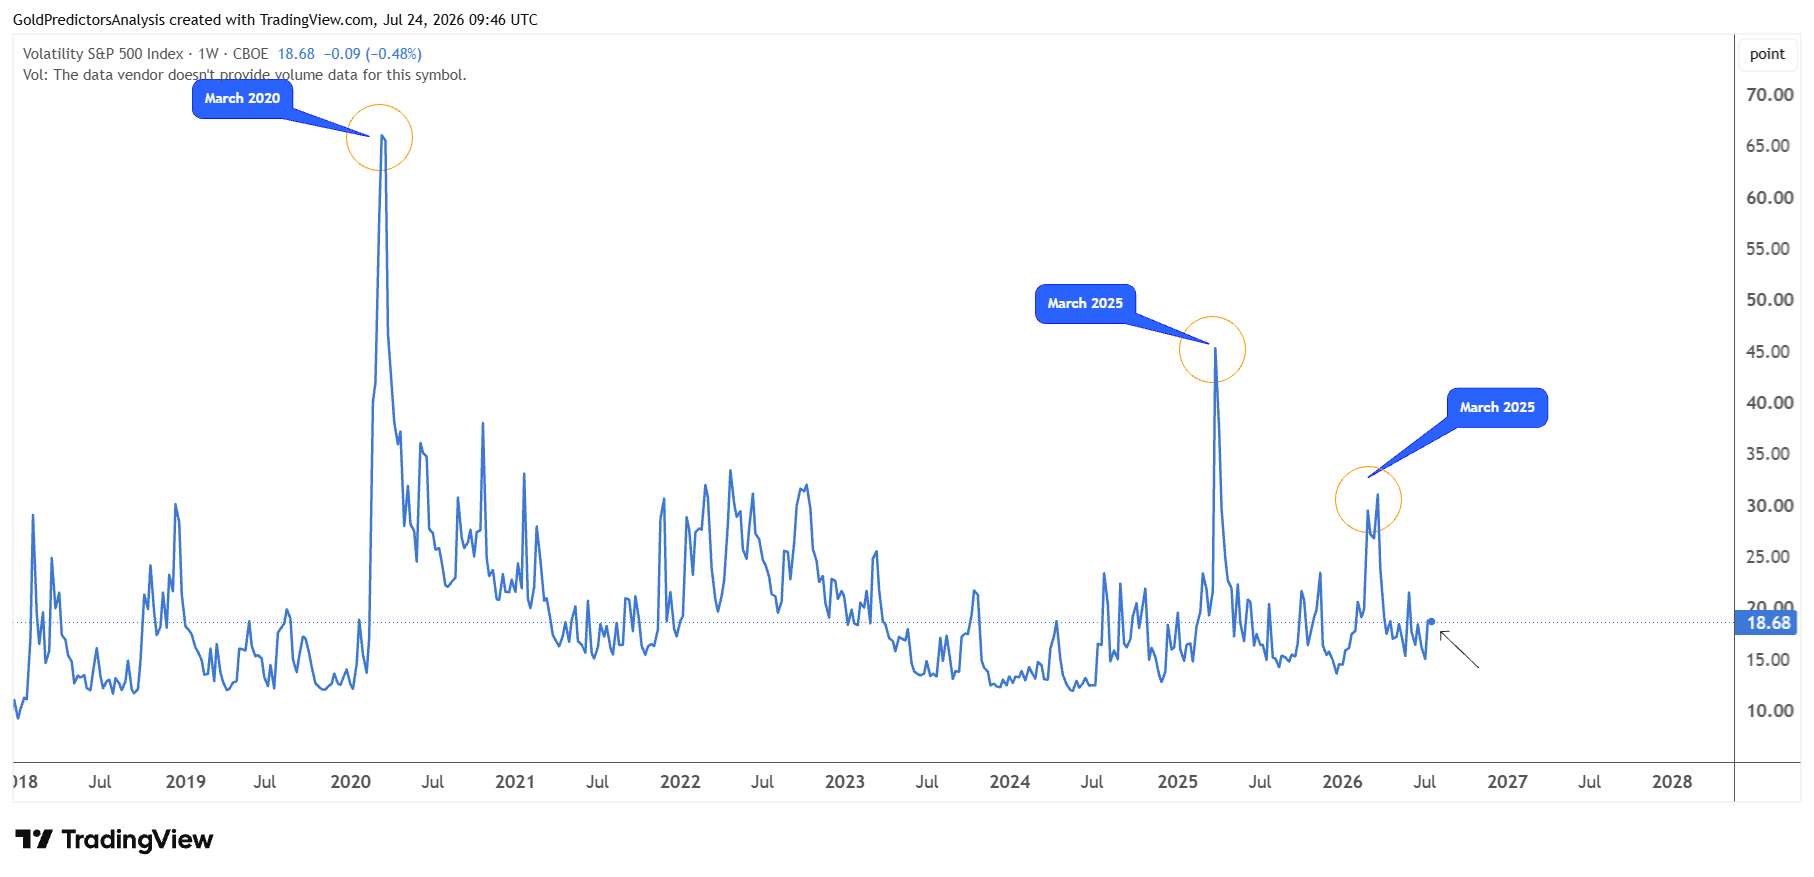
This combination indicates that the market remains volatile until the oil price stabilises, US Treasury yields decline and earnings expectations improve.
Dow Jones Forecast: Oil and Yield Risks Test the Rally
Dow Jones Outlook Remains Supported by Industrial and Defense Stocks
The Dow Jones dropped last week to mark a low at 51,560 on Thursday before a recovery to close the index at 51,917. The index may remain relatively more resilient than the technology-rich Nasdaq due to its higher weightings to industrial, defense, healthcare and other value stocks.
The expectation of increased demand due to increased geopolitical tensions boosted defense stocks. Strong earnings from companies like Lockheed Martin Corp. (LMT) and RTX Corporation (RTX) also contributed to the industrial sector outperforming. The chart below shows that both companies continue to shows strong net income during the past ten years.
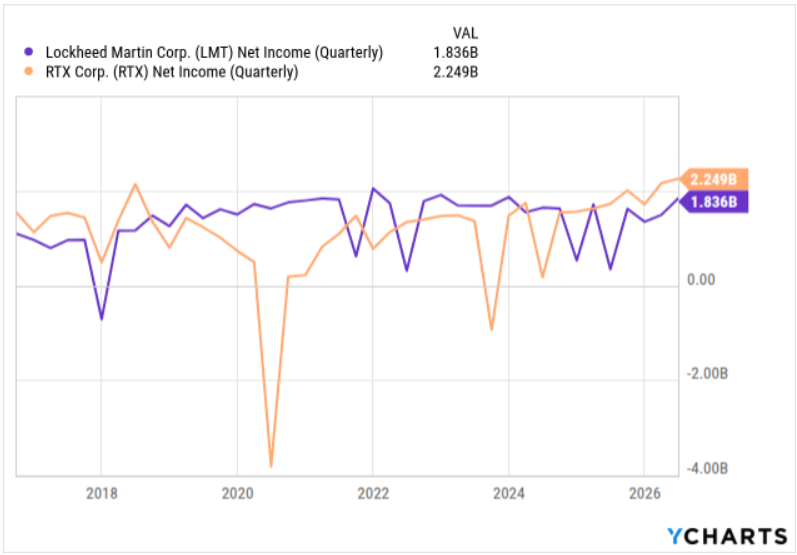
The Dow Jones sentiment is still tied to oil prices, inflation and Treasury yields. The higher energy prices may put downward pressure on consumer and industrial businesses due to increased operating costs. But the strength in defense and some industrial stocks may limit the downside. The index could be volatile in the near term but if oil prices and yields stabilize, buyers might return.
Dow Jones Targets 55,000 Above Key Support
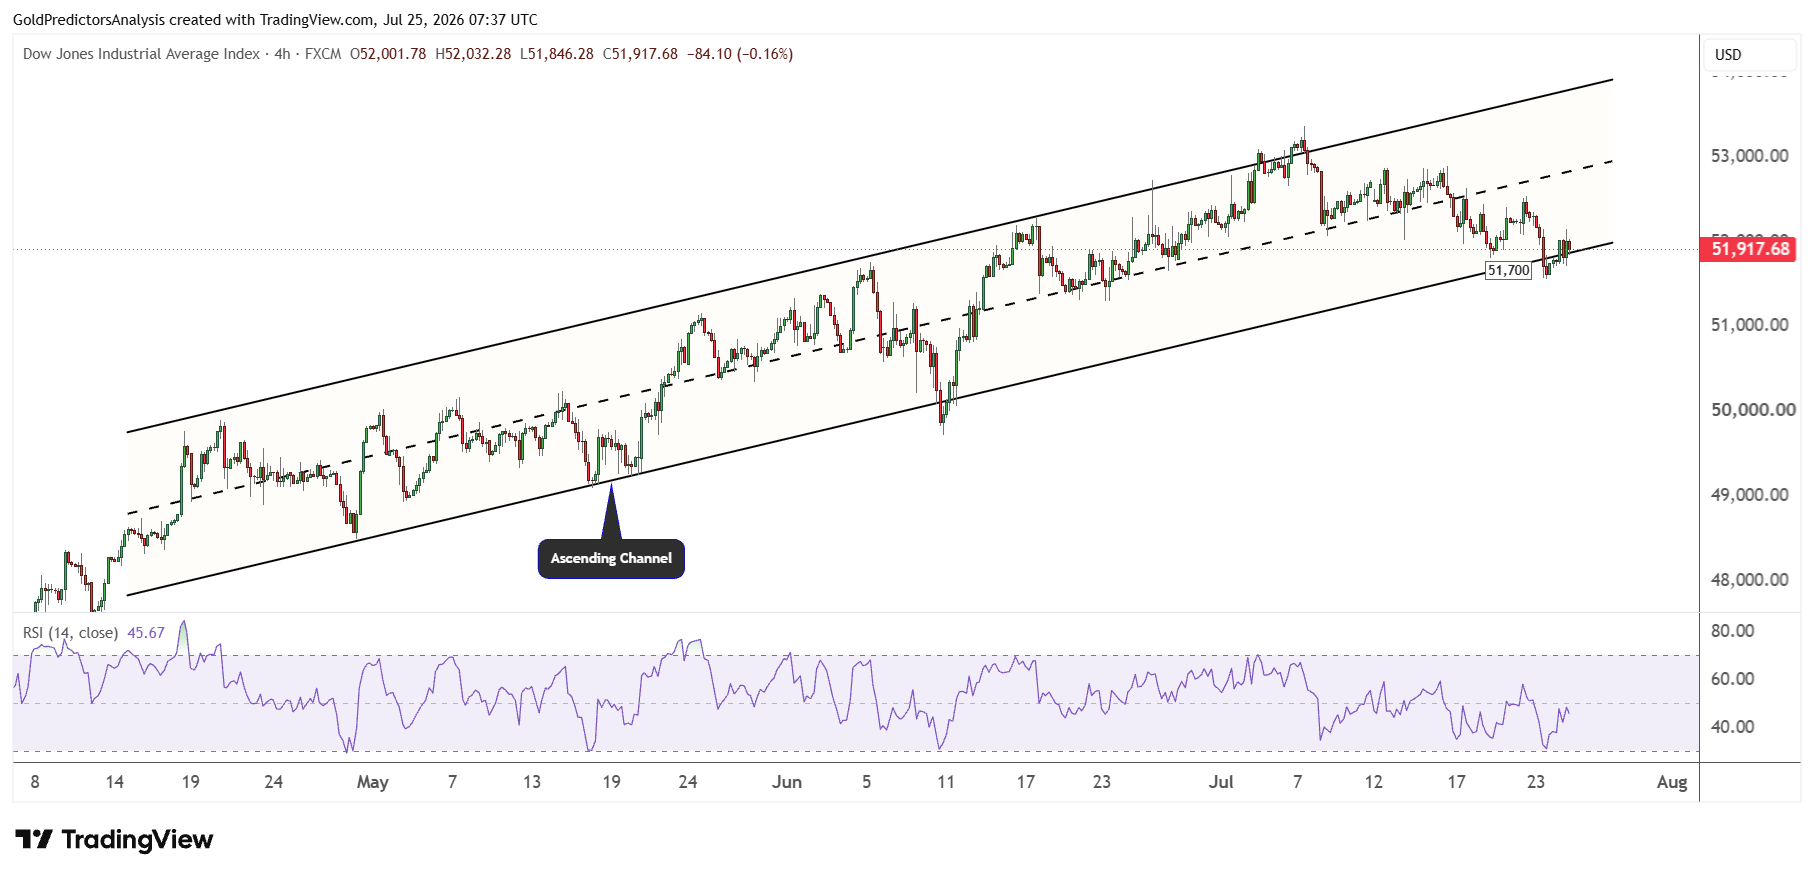
The 4-hour chart for the Dow Jones shows that the index has found strong support at 51,700 as discussed last week. After hitting the support, the index has produced a rebound. A break above the 52,500 level will open the door for the next strong rally towards the 55,000 level. But a break below 51,500 will offer a deeper correction to the 50,000 area.
As long as the Dow Jones remains above the 50,000 level, the long term price structure remains bullish, and the Dow Jones looks for a move towards the 55,000 level.
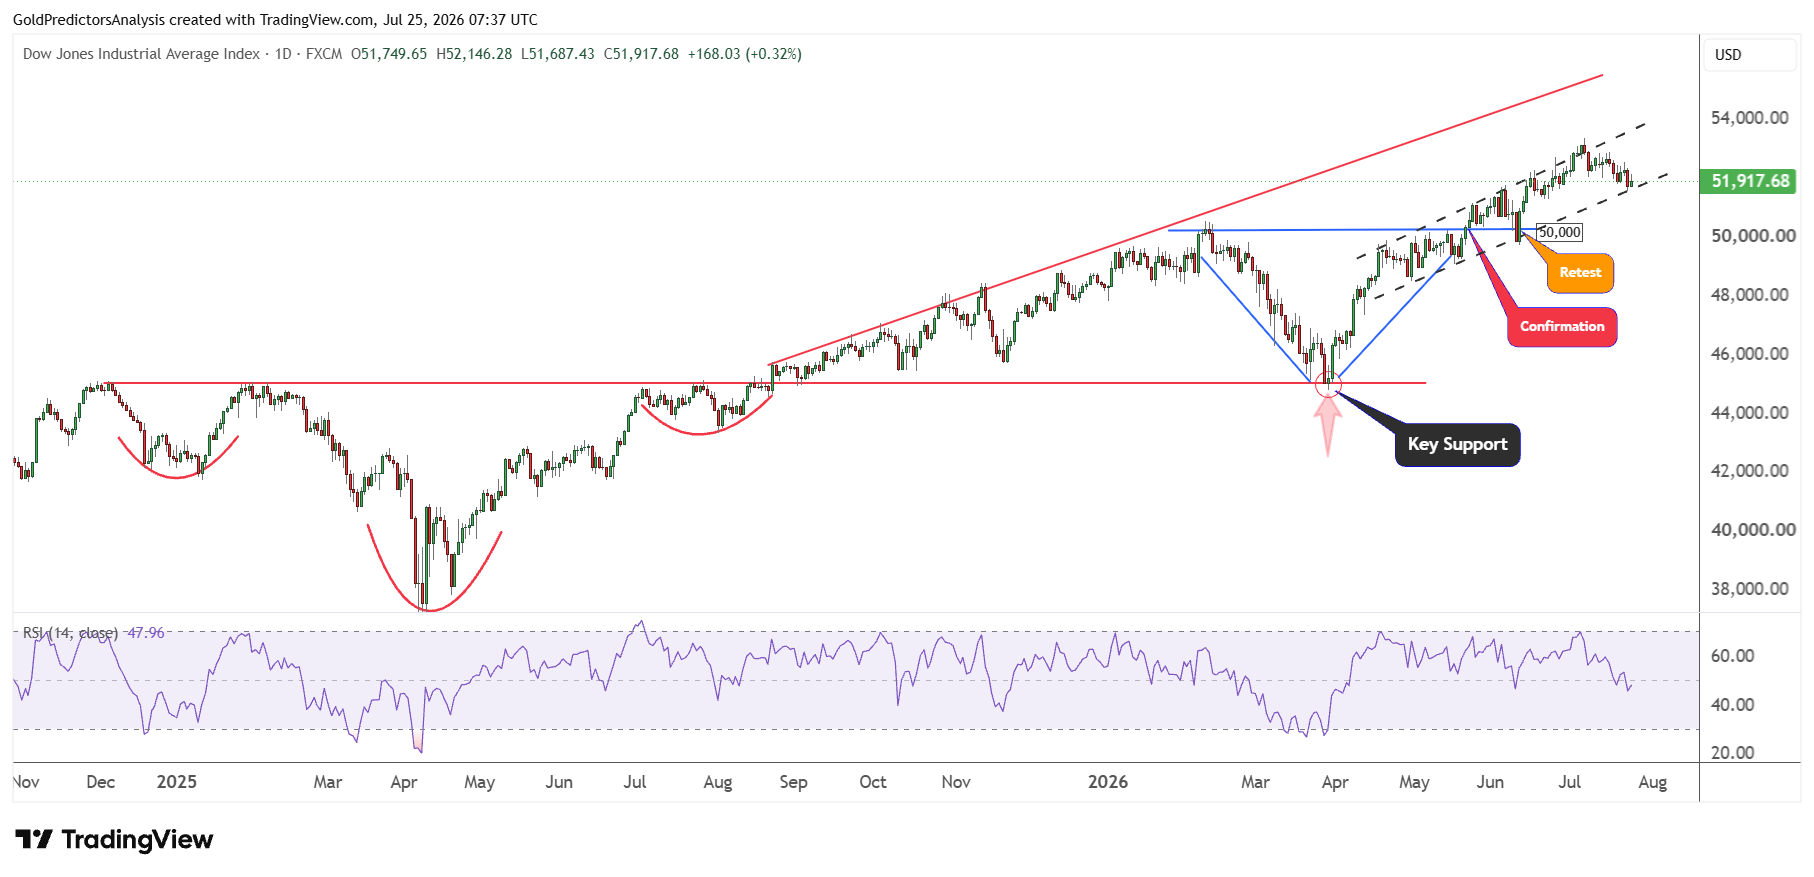
This bullish structure for the Dow Jones is also evident on the daily chart. The daily chart shows an inverted head and shoulders pattern during Q1 2025.
This inverted head and shoulders pattern formed a V-shaped recovery after the breakout and broke the 50,000 level. After the breakout above the 50,000 level, the index has been consolidating within ascending channel. Last week, the index hit the lower boundary of support at the ascending channel. A break below 51,500 will open the door for a drop towards the 50,000 level.
But this correction will offer another pivotal point for long term investors to board for the next rally towards the 55,000 level.
S&P 500 Forecast: Oil and Yield Risks Pressure the Index
S&P 500 Outlook Weakens as Technology Stocks Slide
The S&P 500 dropped last week to mark a low at 7,376 and recovered to close the week at 7,412. This drop was due to the weakness across several sectors. Some of the biggest losses were seen in communication services and consumer discretionary stocks following steep drops by Alphabet and Tesla. This creates a more difficult environment for the index as these big technology and growth stocks play a major role in the index’s trend.
The S&P 500 also faces some pressure from the elevated oil prices and higher Treasury yields. New tariffs also could contribute to inflation if businesses charge consumers more for imported items. If oil and the yields start to correct, then sentiment could improve. But if inflationary pressures persist, then the S&P 500 could be vulnerable to further short term weakness.
S&P 500 Eyes 8,000 Above 7,620
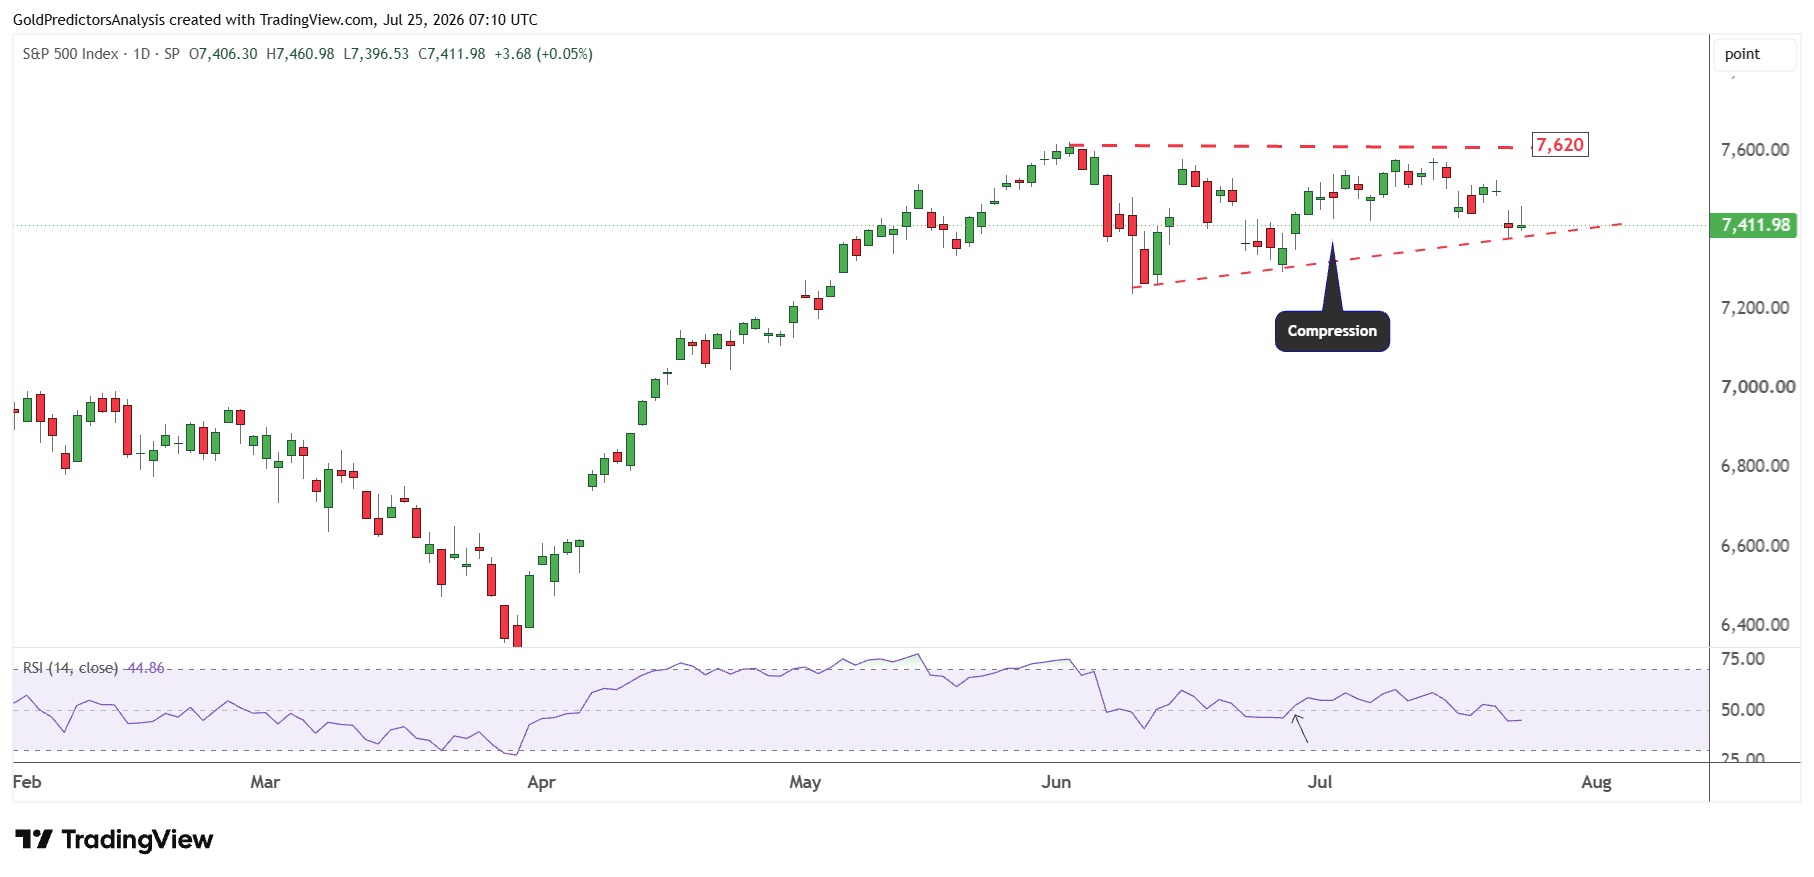
The S&P 500 has been consolidating between 7,200 and 7,600 since June 2026. This consolidation has formed a triangle pattern above the long term support zone of the 7,000 level. This triangle pattern suggests that a break above 7,620 will open the door for strong rally towards 8,000.
The 8,000 level target is defined by the ascending broadening wedge pattern that has stretched from July 2025. As long as the index remains above 7,000, the possibility of an upward surge is likely. But a break below 7,000 will push the index towards the next support of 6,200.
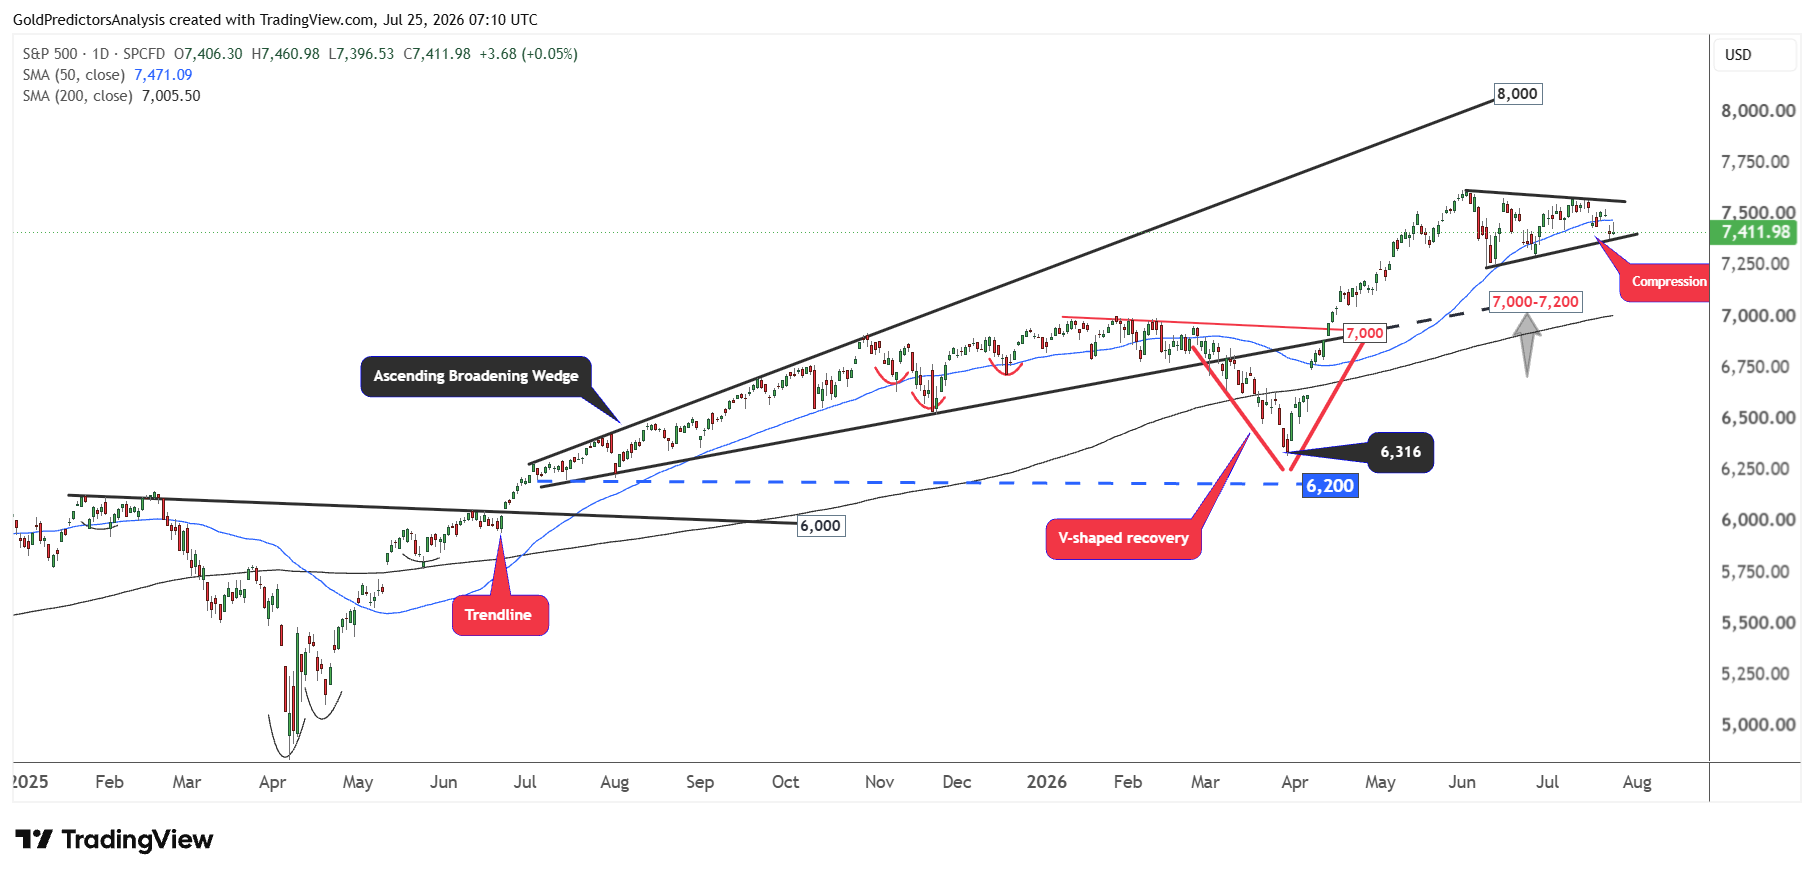
The price compression in the S&P 500 is also observed on the daily chart which shows clear support around the 7,200 level. The short term charts also show that a break above 7,620 will trigger strong surge in the S&P 500. But the rotation from the AI stocks to software stocks may trigger some short term correction in the index.
Bottom Line
The Dow Jones and S&P 500 remain under pressure from higher oil prices, rising Treasury yields and fresh tariff risks. These factors may keep volatility elevated in the short term. But both indices still hold above the important support levels. The Dow Jones remains constructive above 50,000 while the S&P 500 continues to hold above the 7,000 support zone.
A break above 52,500 could strengthen the Dow Jones toward 55,000. Similarly, a break above 7,620 in S&P 500 will open the way toward 8,000. Until these levels break, the market may continue to consolidate and correct lower towards the support zones. Oil prices, Treasury yields and inflation expectations will likely remain the main drivers of the next move on Wall Street.