


The Dow Jones Industrial Average faces a mixed outlook as new U.S. tariffs raise concerns about higher business costs and wider trade conflict. Treasury yields and interest rate risks may also keep the index volatile in the short term. But the strong earnings, steady consumer spending and stable labor market continue to support the market. The Dow may correct toward key support levels but the broader trend remains bullish as long as the index remains above the key support zone.
U.S. Tariffs on Brazil Raise Risks for Dow Jones Stocks
The US will impose 25% tariffs on a large number of Brazilian products from July 22. These goods include machinery, furniture, footwear, sugar, apparel and electrical goods. This could increase prices for U.S. businesses that rely on Brazil’s exports. An increase in the price of inputs may then lead to decline in profits and force businesses to increase their prices.
The new duties won’t apply to beef, coffee, energy products, rare earths, aircraft and aircraft parts. Protection was also provided for pig iron and “steel scrap”. They lower the short-term risks for the major U.S. industrial and consumer firms, but not the overall trade risks.
Brazil could be the first of many to fall victim to the new tariff strategy. The US may launch similar steps against China, India, Japan, South Korea and the European Union. A significant portion of the sales of many Dow Jones companies comes from outside the U.S. They also have complicated supply chains that operate across the globe. A more general tariff war could result in cost increases, reduced demand overseas and less predictable earnings.
Brazil says it will retaliate under the Reciprocity Law and challenge the tariffs to the World Trade Organization. Retaliation could negatively impact U.S. exports and add additional volatility for US companies with significant international operations. Therefore, investors may demand lower valuations for industrial, financial and consumer stocks until the trade situation becomes a little clearer. The escalating trade tensions could dampen the Dow’s momentum and result in short-term corrections, but the broader trend remains bullish.
Dow Jones Price Forecast
Every new Dow Jones analysis as it publishes, today's technical signal and key levels, live price — on one page.
See all Dow Jones forecastsTreasury Yields and Fed Rate Risks Keep Dow Jones Volatile
The US Treasury yields dropped after the release of inflation data. The 2-year yield dropped to 4.18% while the 10-year yield eased to 4.55%. The lower yields can have a positive effect on the stock market as lower borrowing costs make equities more attractive when compared to bonds. This may offer a short term relief for the Dow Jones.
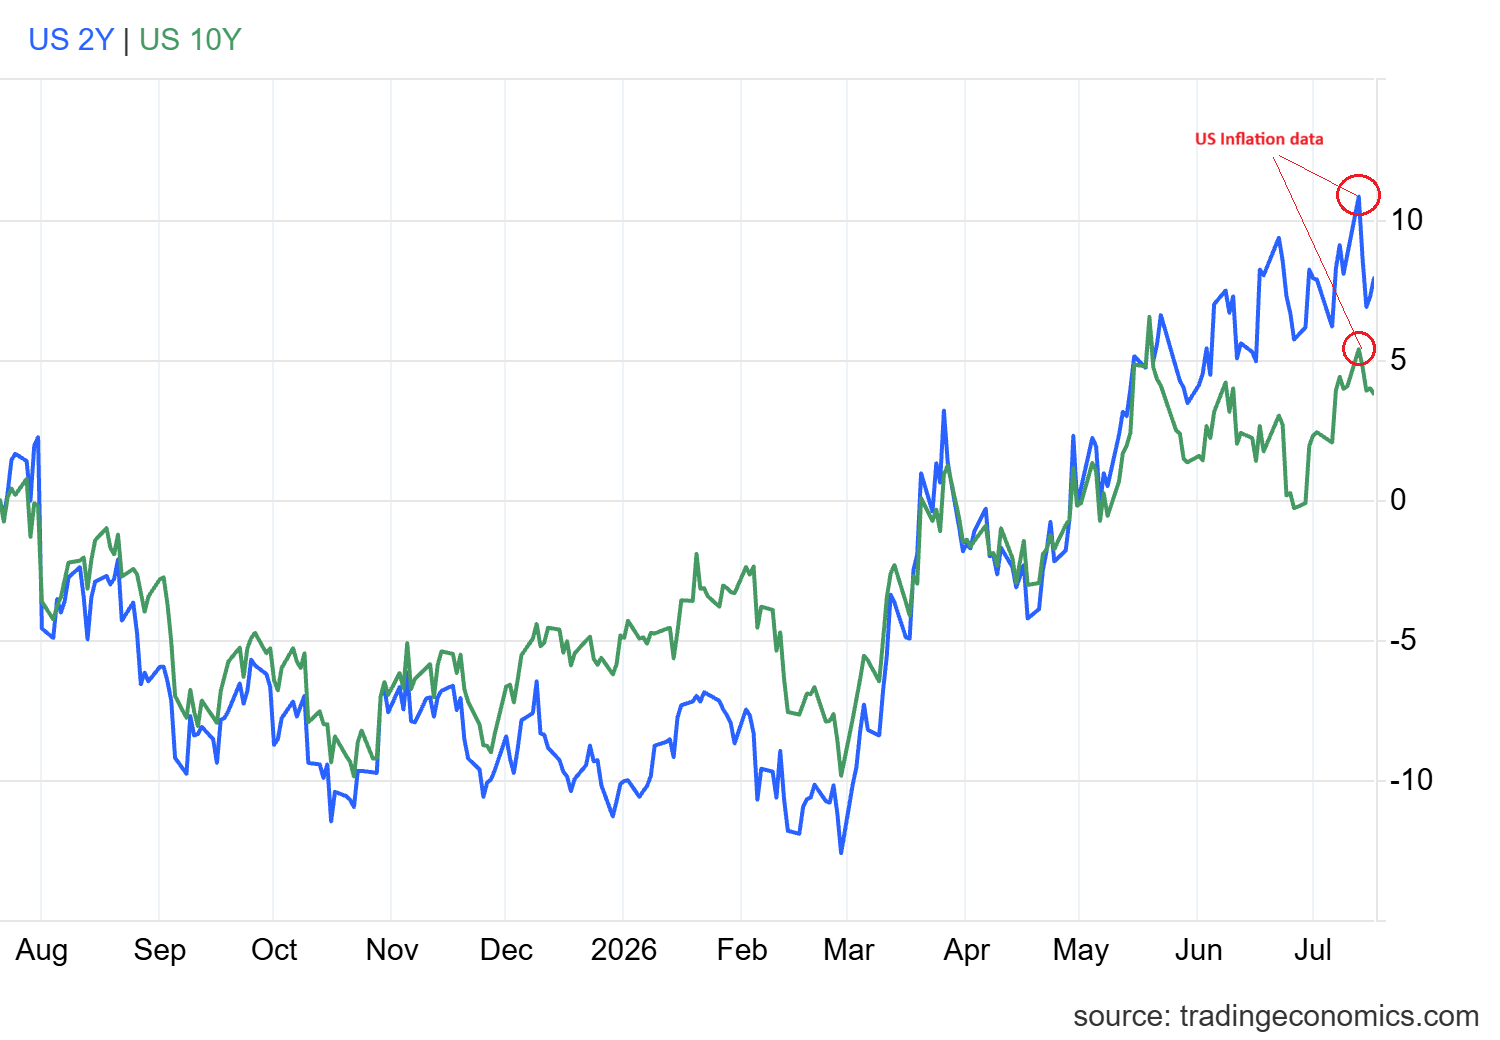
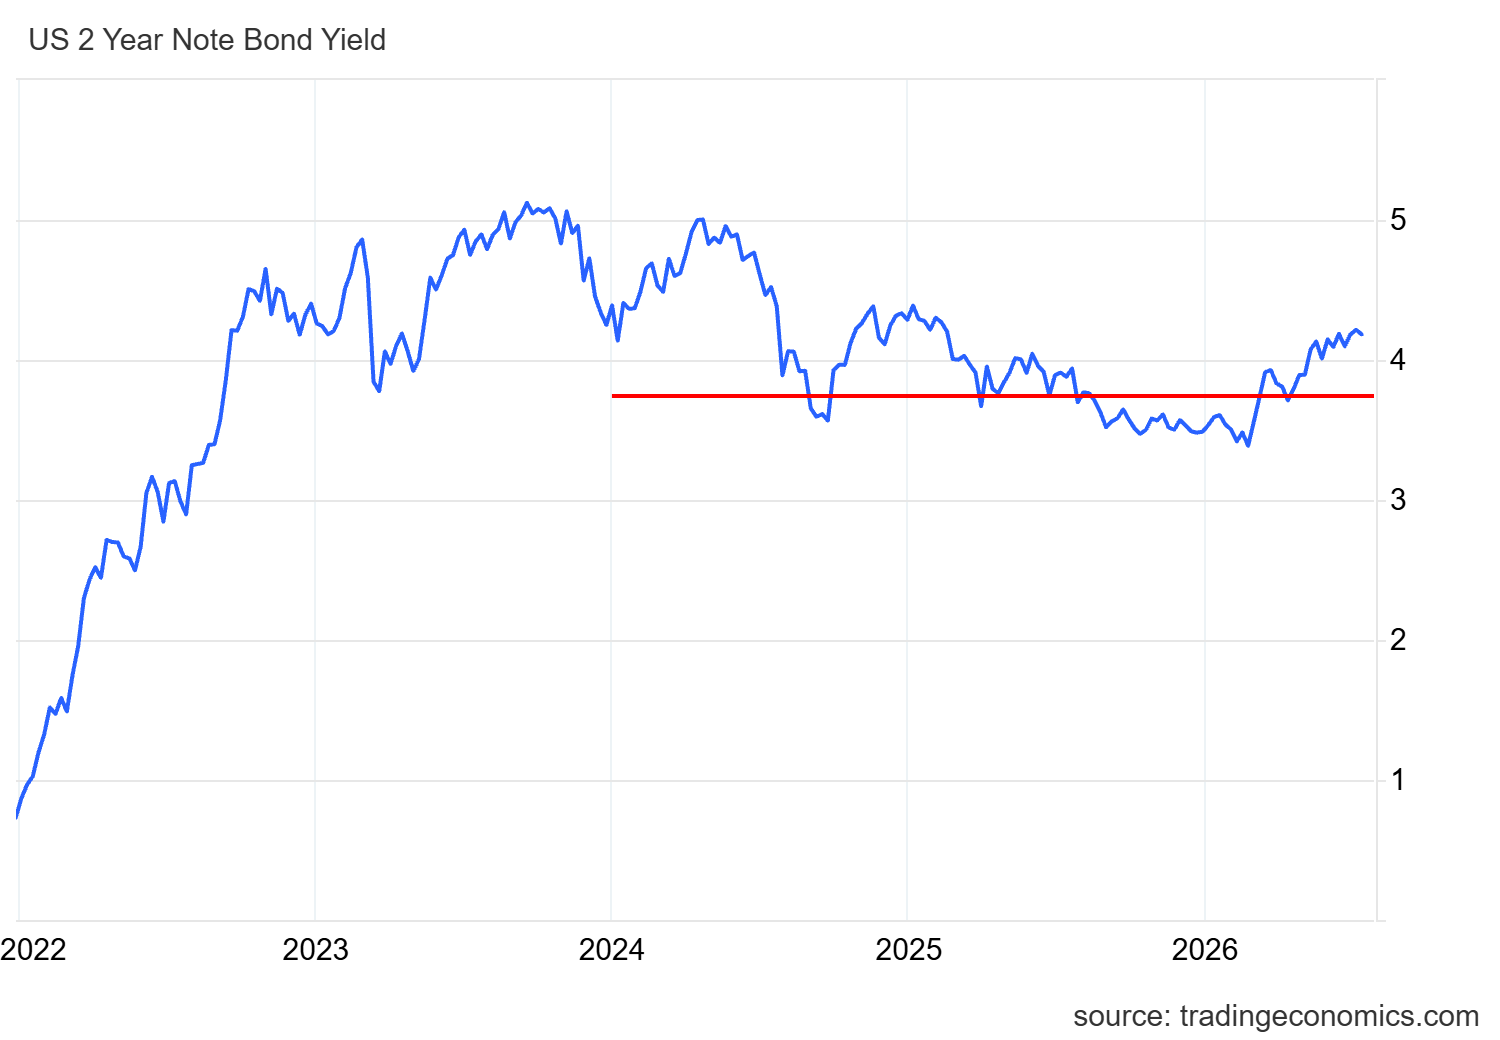
But the risk of higher interest rates has not disappeared. The 2-year Treasury yield remains roughly 50 bps above the midpoint of current federal funds targeted range. This suggests that the bond market expects interest rates to be higher on average over the next two years. This potential reflects the possibility of two 25 bps rate hikes. The escalating Middle East crisis further indicates the possibility of higher inflation and higher Treasury yields. This further increases the likelihood of higher interest rates.
The first quarter of this year saw nominal GDP growth at 6.1% a year. This is a wide spread between nominal growth and the 10-year Treasury yield. In my view, this gap suggests that the monetary conditions remain too loose to control inflation over the long term.
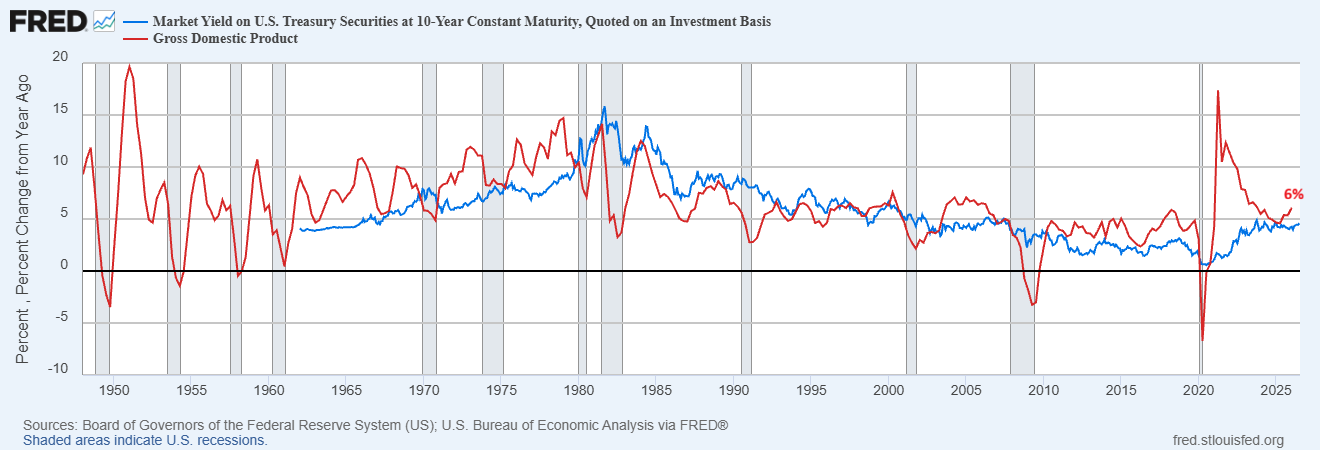
The Fed now has a hard decision to make. The higher long term rates could control the inflation but increase the cost of borrowing for the government, businesses and homes. The suppression of yields might save the Treasury market and could weaken the purchasing power of dollar and create negative real interest rates. The first outcome would put the market valuations of equities under pressure but the second could eventually support the real assets and stocks. This conflict may keep the Dow Jones volatile even if the long term trend remains positive.
Strong Earnings and Consumer Spending Support the Dow Jones
The Dow Jones produced negative candles on Thursday and Friday last week and closed the week at 52,172. These losses in the Dow Jones last week are less than those in the Nasdaq and S&P 500. This relative strength is due to the Dow’s less exposure to the semiconductor industry. Technology stocks dropped after Taiwan Semiconductor Co. (TSM) increased the capital expenditure forecast. Some of the leading chip makers tumbled.
The corporate profits still provide a strong base for the broader market. The major companies of S&P 500 reported better than expected earnings. These companies also include major banks. When banks perform well, it suggests that credit activity is good, consumers are spending and the economy is growing. These conditions are favorable for the Dow’s financial and industrial businesses.
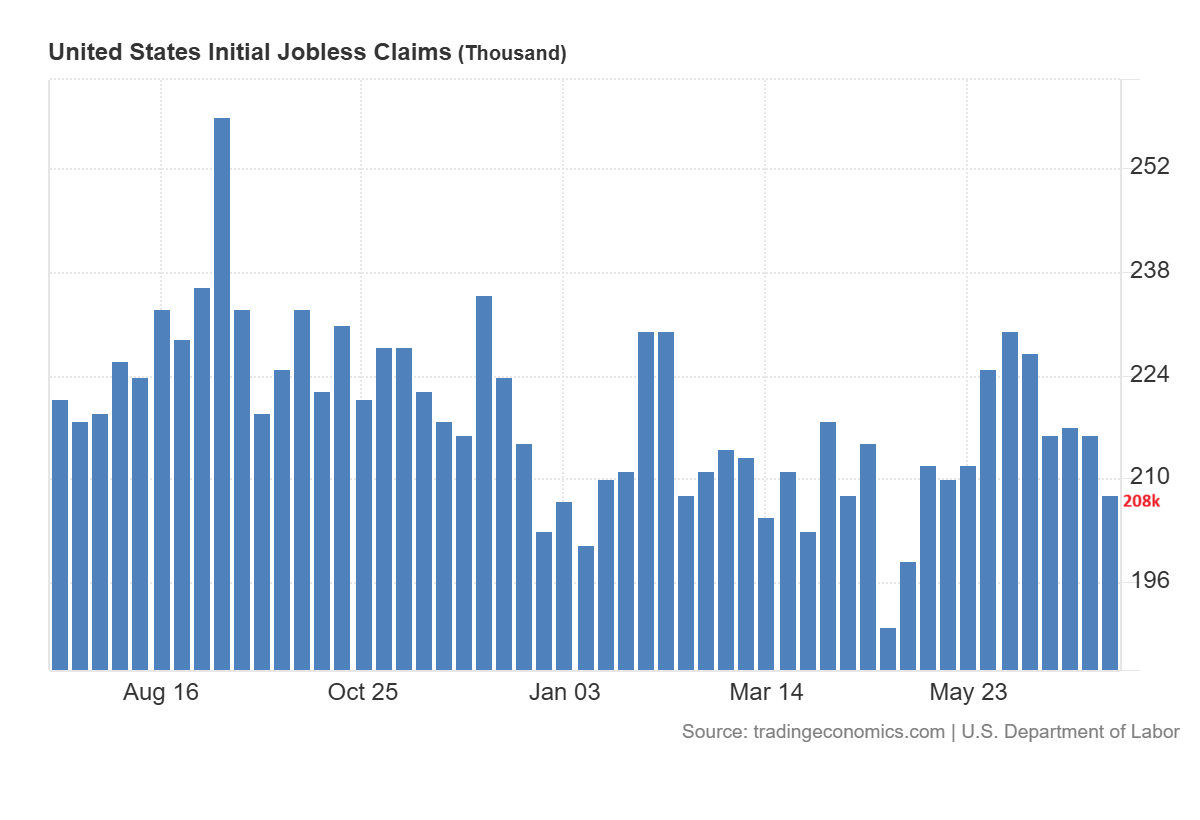
The U.S. consumer also remains resilient. The number of weekly jobless claims dropped to 208,000. This is the lowest initial claim count in the two months. The continuing claims also dropped to 1,805,000. This data suggests that the layoffs remain limited and the labor market is stable even as growth in the labor force slows.
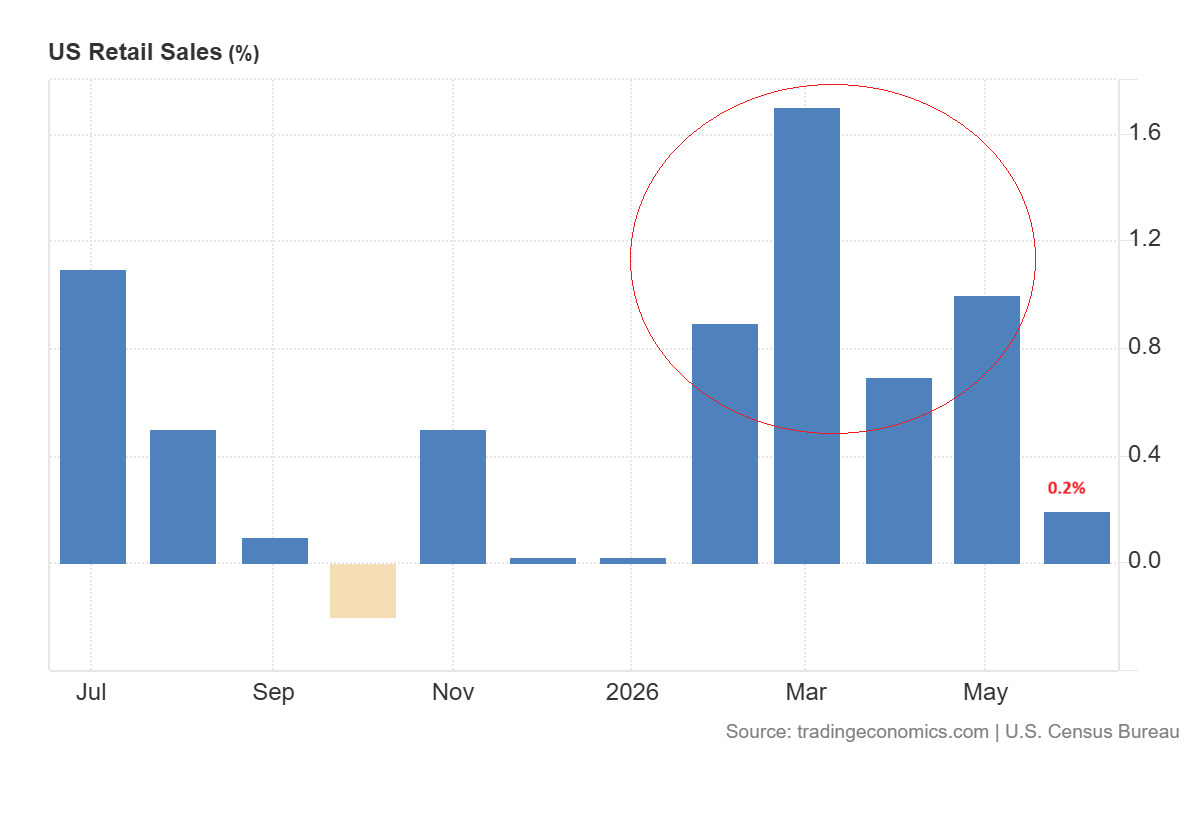
The retail sales increased by 0.2% in June. These numbers indicate that the economy could still withstand higher prices and borrowing costs. As the risks of tariffs increase, the Dow could consolidate or experience a short term correction. But as trade uncertainty starts to ease, more gains may be on the horizon with solid earnings and economic activity.
Dow Jones Forecast: Can the Index Rally To 55,000?
The long term outlook for the Dow Jones remains strongly bullish despite the correction from the 53,360 level in July. This bullish structure is defined by the inverted head and shoulders pattern from 2021 to 2023 and the formation of wedge pattern from 2024.
The index formed V-shaped recoveries in April 2025 and April 2026. These recoveries suggest that the momentum in Dow Jones is strong. But the RSI indicator shows that the index has become overbought in the short term and calls for a correction.
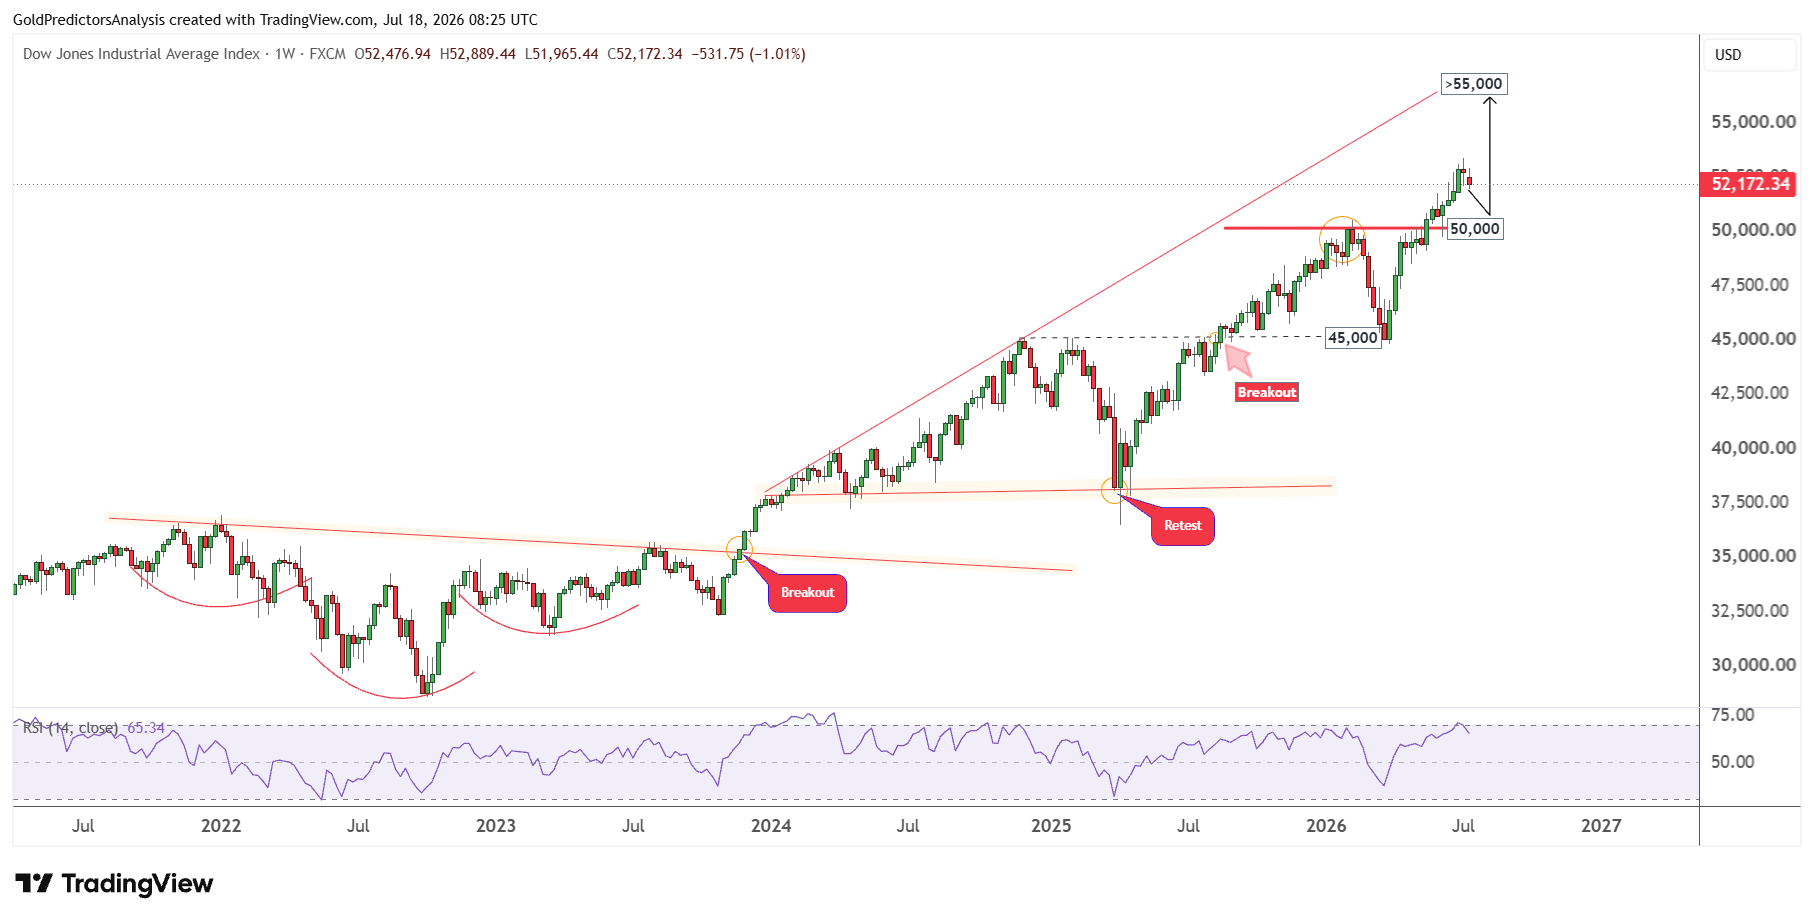
The immediate support for the Dow Jones remains at 50,000, which is a strong support area. If the Dow Jones starts to correct toward this level, it will likely form another bottom and may trigger a strong rally toward 55,000. The target of 55,000 is defined by the strong resistance of the ascending broadening wedge pattern.
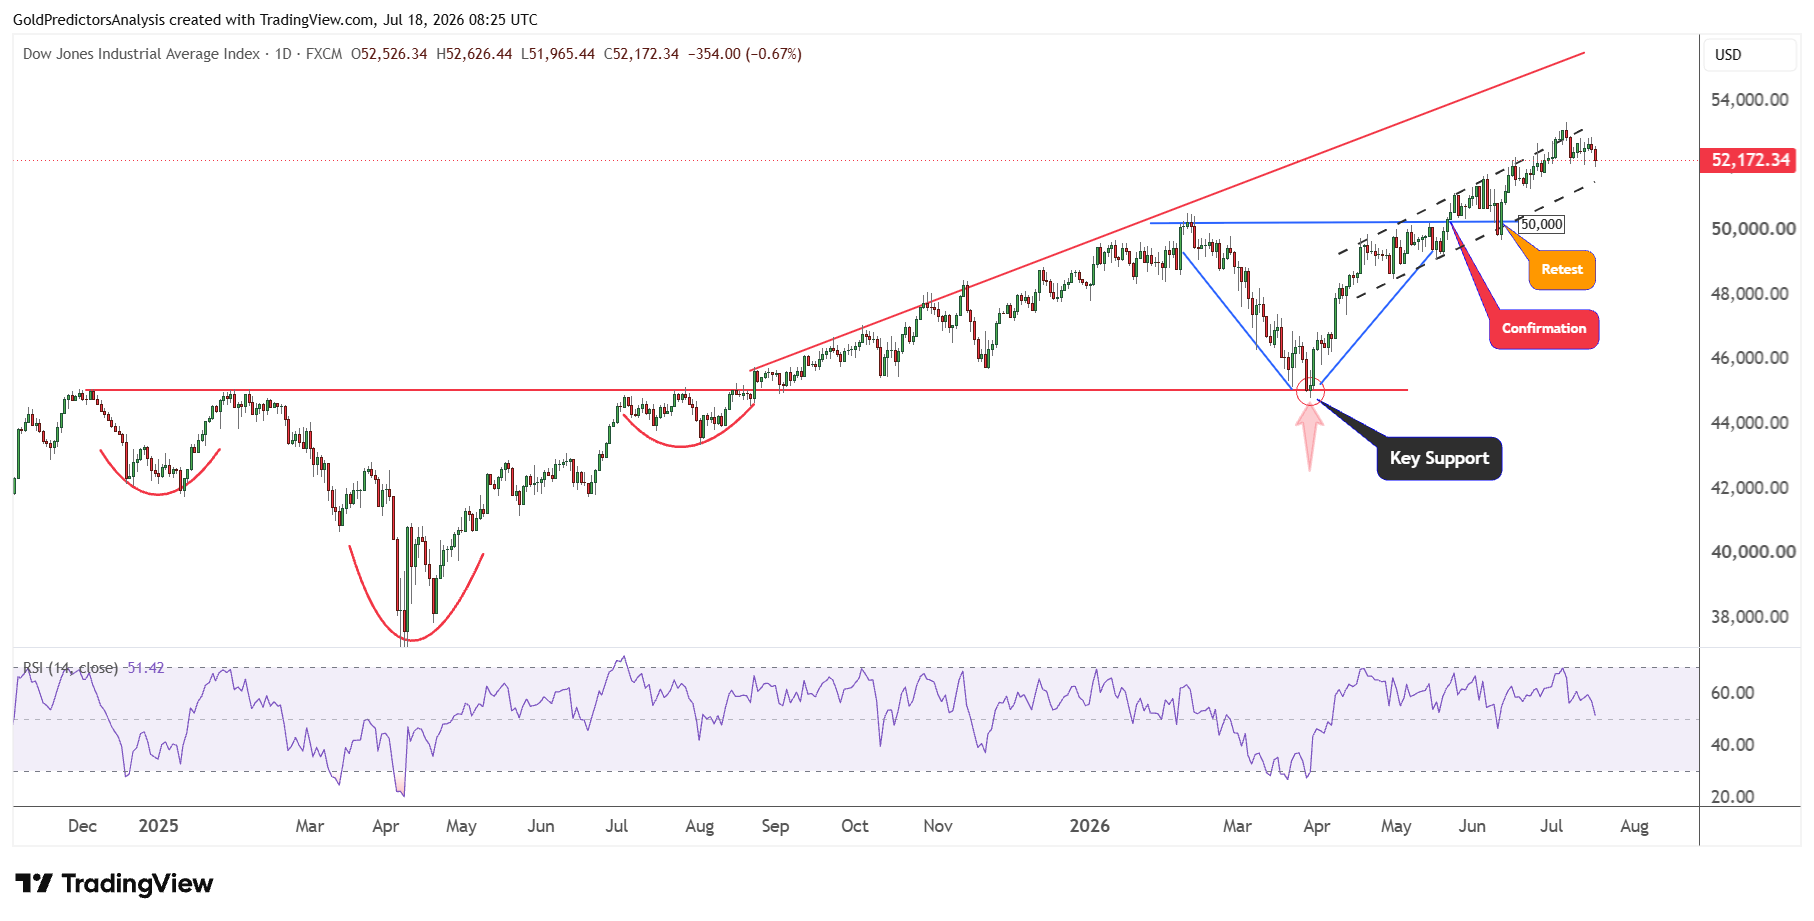
It is interesting to note that the inverted head and shoulders pattern in 2025 also supports the bullish outlook for the Dow Jones. A similar bullish structure is evident on the daily chart which also highlights the V-shaped recovery in April 2026. Once the price recovered from the 45,000 level, it remained above this level. The index has been consolidating within ascending channel pattern since April 2026.
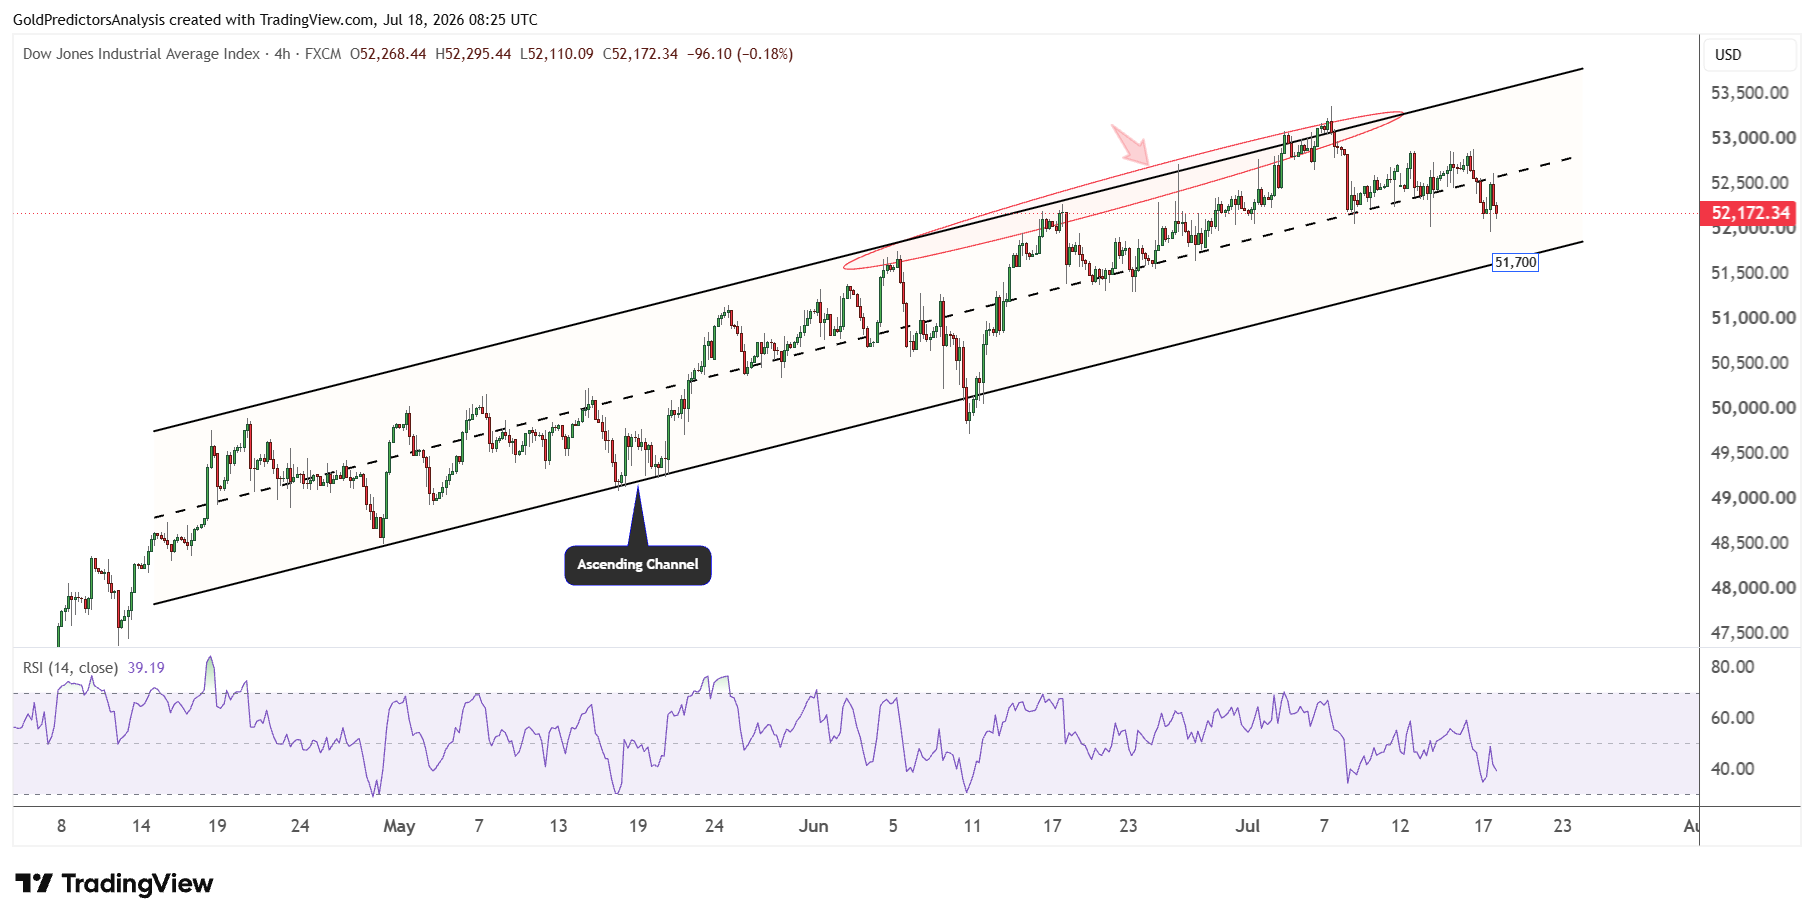
This ascending channel is clearly observed on the 4-hour chart, which shows that the important support is at 51,700 before the 50,000 area. Any correction within this ascending channel may provide the foundation for the next rally in Dow Jones.
Bottom Line
The Dow Jones remains volatile as the new tariffs and higher interest rates risk weigh on the stock market. A broader trade conflict could boost expenses for some companies and hurt profit margins. But the favorable corporate performance, consumer confidence and modest unemployment claims are all still supporting the market. These conditions may limit the downside while the economic outlook remains strong.
The technical picture also remains bullish despite the possibility of a short-term correction. The 51,700 level is the initial support and the 50,000 area remains a key support zone. These technical support zones may be treated as a magnet for the next rally in Dow Jones. A break below 50,000 may open the door for the next drop to 45,000.
Read more: S&P 500 Eyes 8,000 Despite Fed Risks