Gold Tests Key Support After Trend Weakness
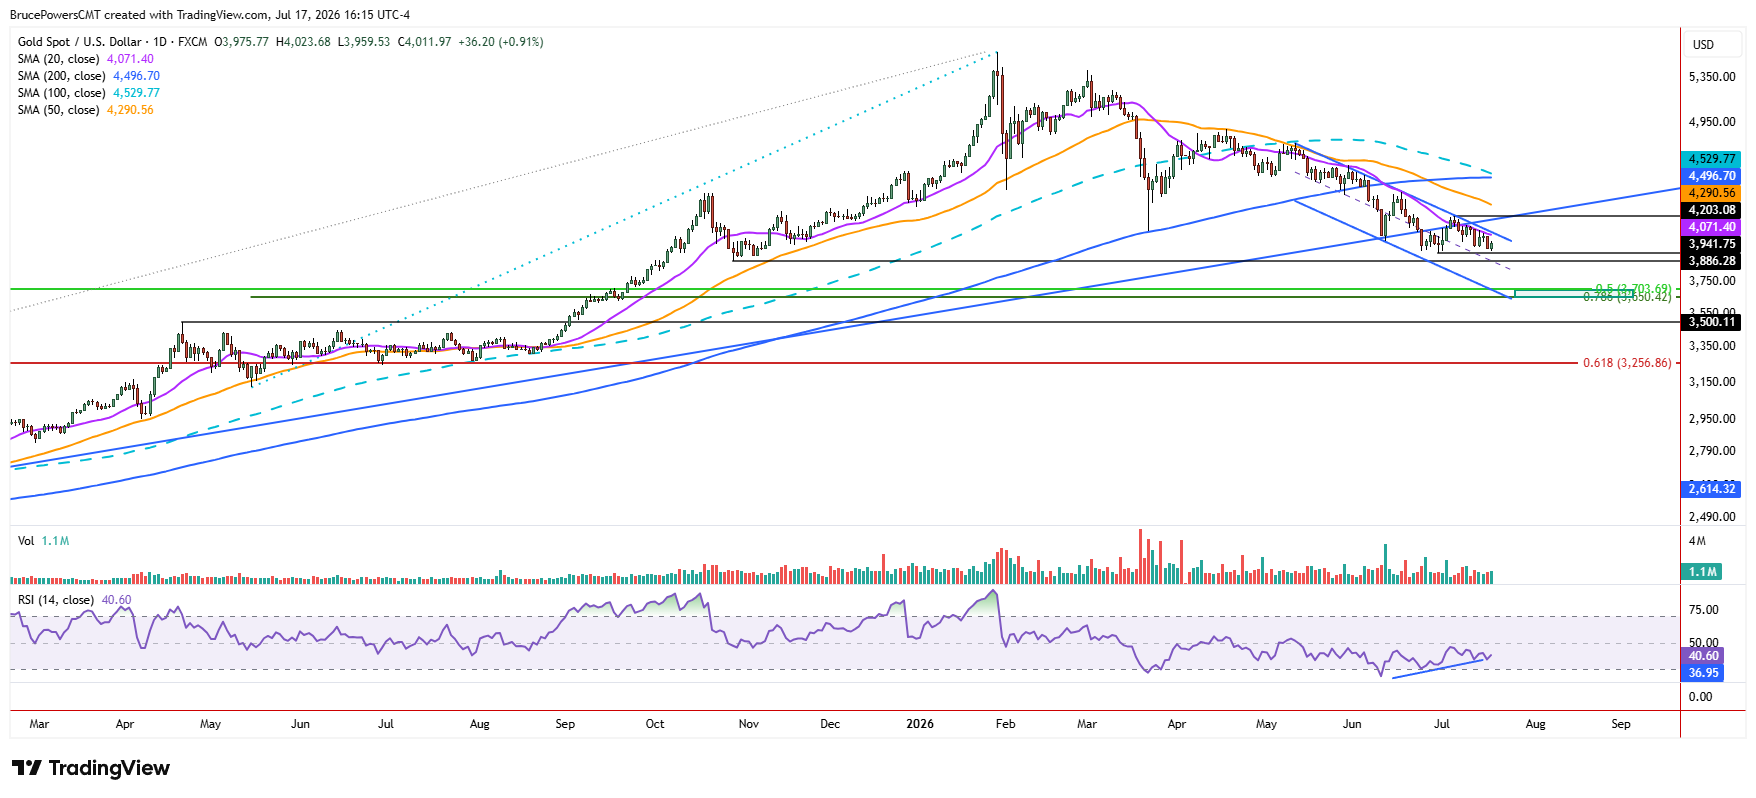
Gold fell very close to the current trend low of $3,942 on Friday, reaching a lower daily low of $3,960 before an intraday bounce followed. A lower daily high was generated at $4,024, marking near-term resistance. Nonetheless, key dynamic resistance is marked by the falling 20-day moving average, now near $4,071. It has been confirmed as resistance with the highs of the prior seven days.

Long-Term Trend Shows Signs of Deterioration
Since a lower swing high was established at $4,203, gold has steadily fallen, with bearish momentum starting to show signs of acceleration over the past couple of days. Of significance is the break below the long-term uptrend line that occurred three weeks ago. It shows a weakening of the bullish trend measured from around the February 2024 swing low. The other long-term trend indicator, the 200-day moving average, was already broken to the downside at the beginning of June, showing a change in momentum.
Mixed Signals Create a Critical Decision Point
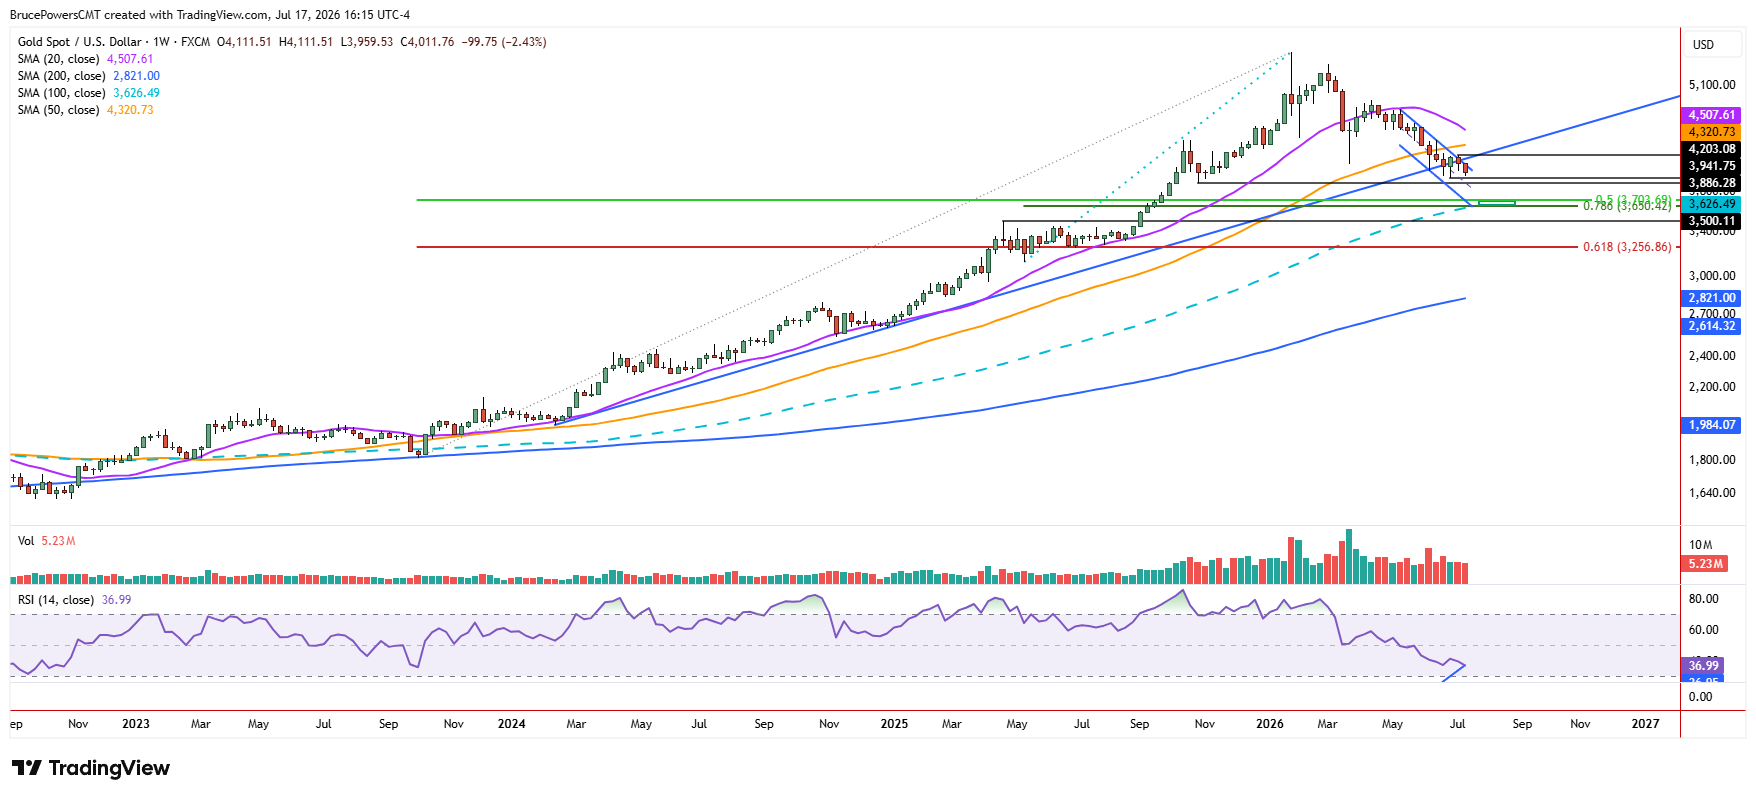
The combination of a break below a rising trendline and consistent confirmed resistance at the 20-day moving average, shows long-term and short-term alignment. Although this adds to downward pressure, the reluctance of selling pressure to increase noticeably since last week’s lower swing high, leaves open the possibility for a relatively quick recovery of the two trending indicators. The 20-day moving average is now near $4,071 and Wednesday’s high of $4,081 can be used as a proxy for the indicator.
Lower Support Levels Come into Focus
If the current trend low of $3,942 is broken to the downside, the higher swing low of $3,886 becomes a target, and it is at risk of failure as well. A decisive break below that initial target leads to a possible eventual test of support in a range from around $3,702 to $3,650, consisting of the 50% retracement of a prior upswing and the 78.6% Fibonacci retracement of a larger previous upswing.
A Reversal Requires Stronger Confirmation
Despite the signs of strength indicated by a reclaim of the 20-day moving average, a bullish reversal of structure above last week’s high would be needed for a more reliable sign of a bullish reversal. However, the next upside target is at the falling 50-day moving average at $4,291 and it is rapidly falling towards last week’s high.
Gold Price Forecast
Every new Gold analysis as it publishes, today's technical signal and key levels, live price — on one page.
See all Gold forecastsIf you’d like to know more about how to trade gold and silver, please visit our educational area.