Natural Gas Consolidates Near Critical Support
For the fifth consecutive session, natural gas hovered near recent lows on Friday in a narrow consolidation pattern near resistance from the 100-day moving average. Thursday’s wide range established the current resistance level of the range at $2.97 and support at $2.82. Support has been defined by the higher swing low at $2.86 and the 61.8% Fibonacci retracement of the prior advance at $2.84. This combination of nearby support levels makes the current consolidation an important test of whether buyers can regain control or whether sellers will resume the decline.
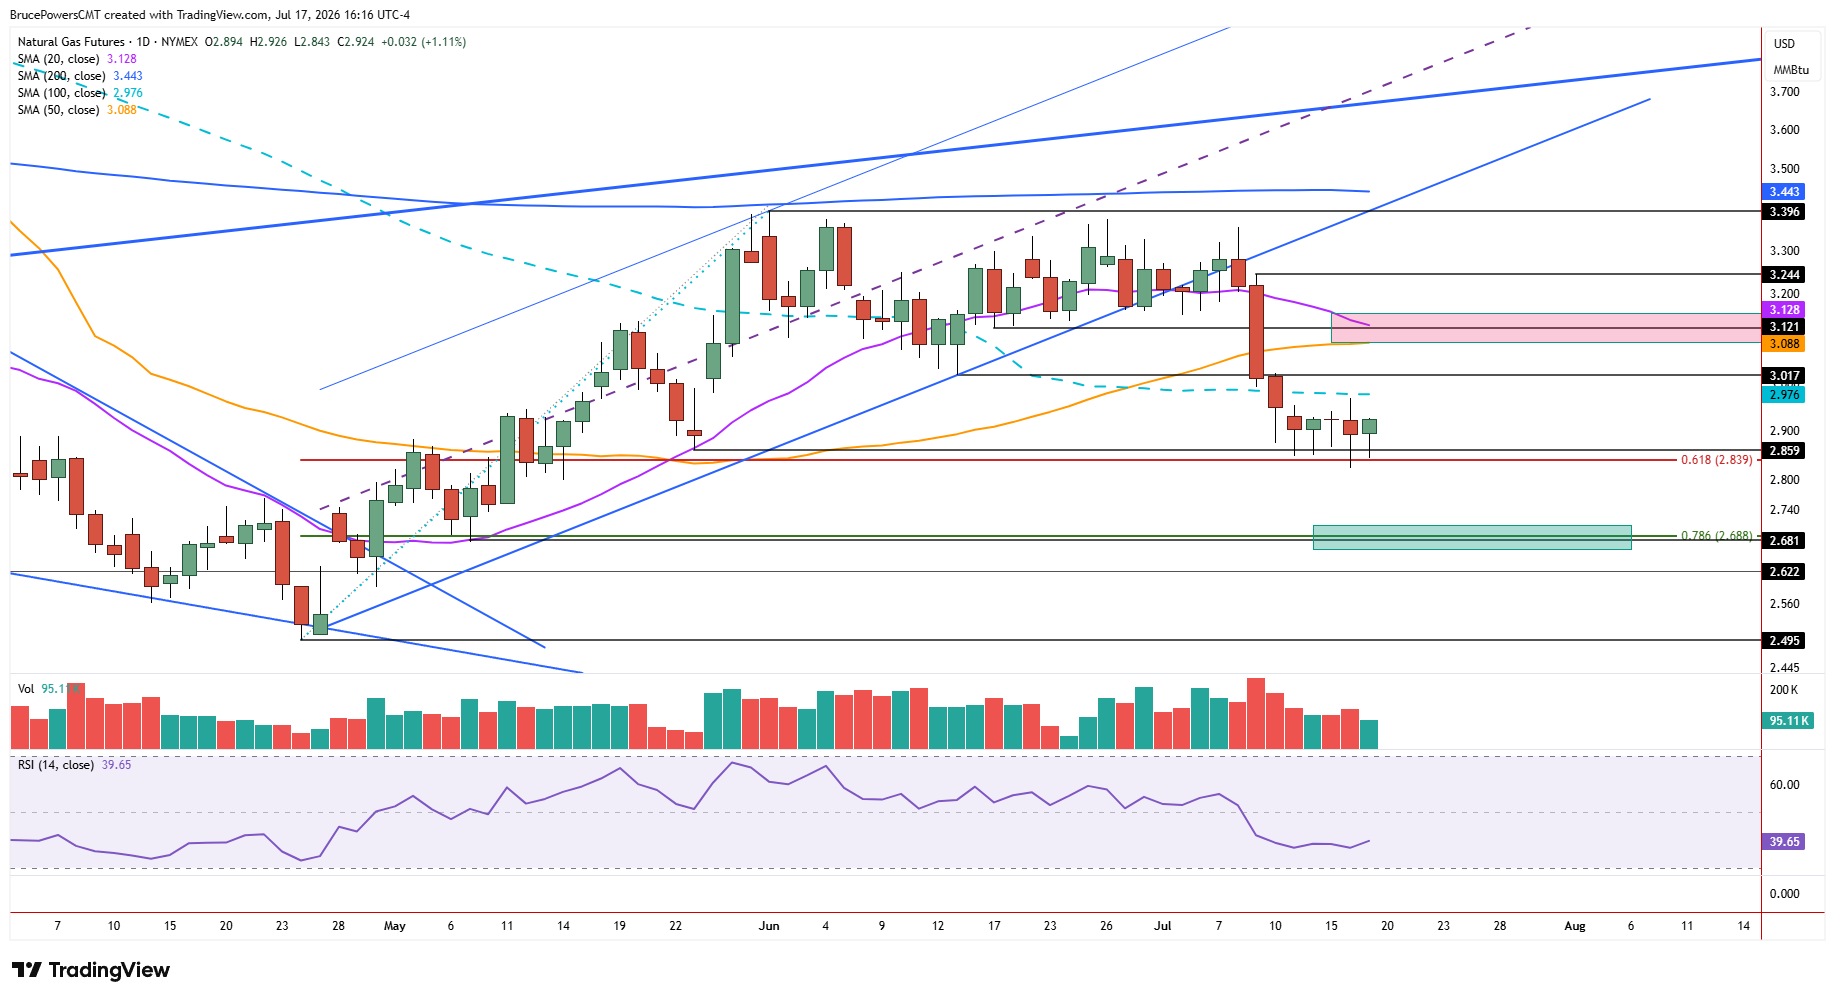
Although natural gas has stopped falling, it remains under pressure and the support test has not attracted meaningful buyers. Both the narrow range and successful test of resistance near the 100-day moving average are bearish indications and suggest sellers are remaining in control overall.
Currently, natural gas looks likely to either bounce toward upside targets before turning back down for another leg down following the recent break below the uptrend line or resume the decline with a breakdown below $2.82. Either outcome would likely provide a clearer signal regarding the next directional move.

Resistance Levels Define the Bullish Challenge
A decisive rally above $2.96 would signal a bullish reversal and a reclaim of the 100-day moving average. However, key potential resistance lies near the zone extending from the 50-day moving average at $3.08 up to the 20-day moving average, currently near $3.13. This area represents an important upside target and is also expected to act as a potential barrier, where sellers may attempt to regain control and resume the broader bearish trend.
Breakdown Below $2.82 Opens Lower Targets
Alternatively, a sustained decline below $2.82 provides a bearish signal for the extension of the bearish trend. Once confirmed by a daily close below that level, the next lower target would be near $2.68-$2.69, consisting of the 78.6% Fibonacci retracement and an interim swing low, respectively.
Broader Downtrend Awaits Confirmation
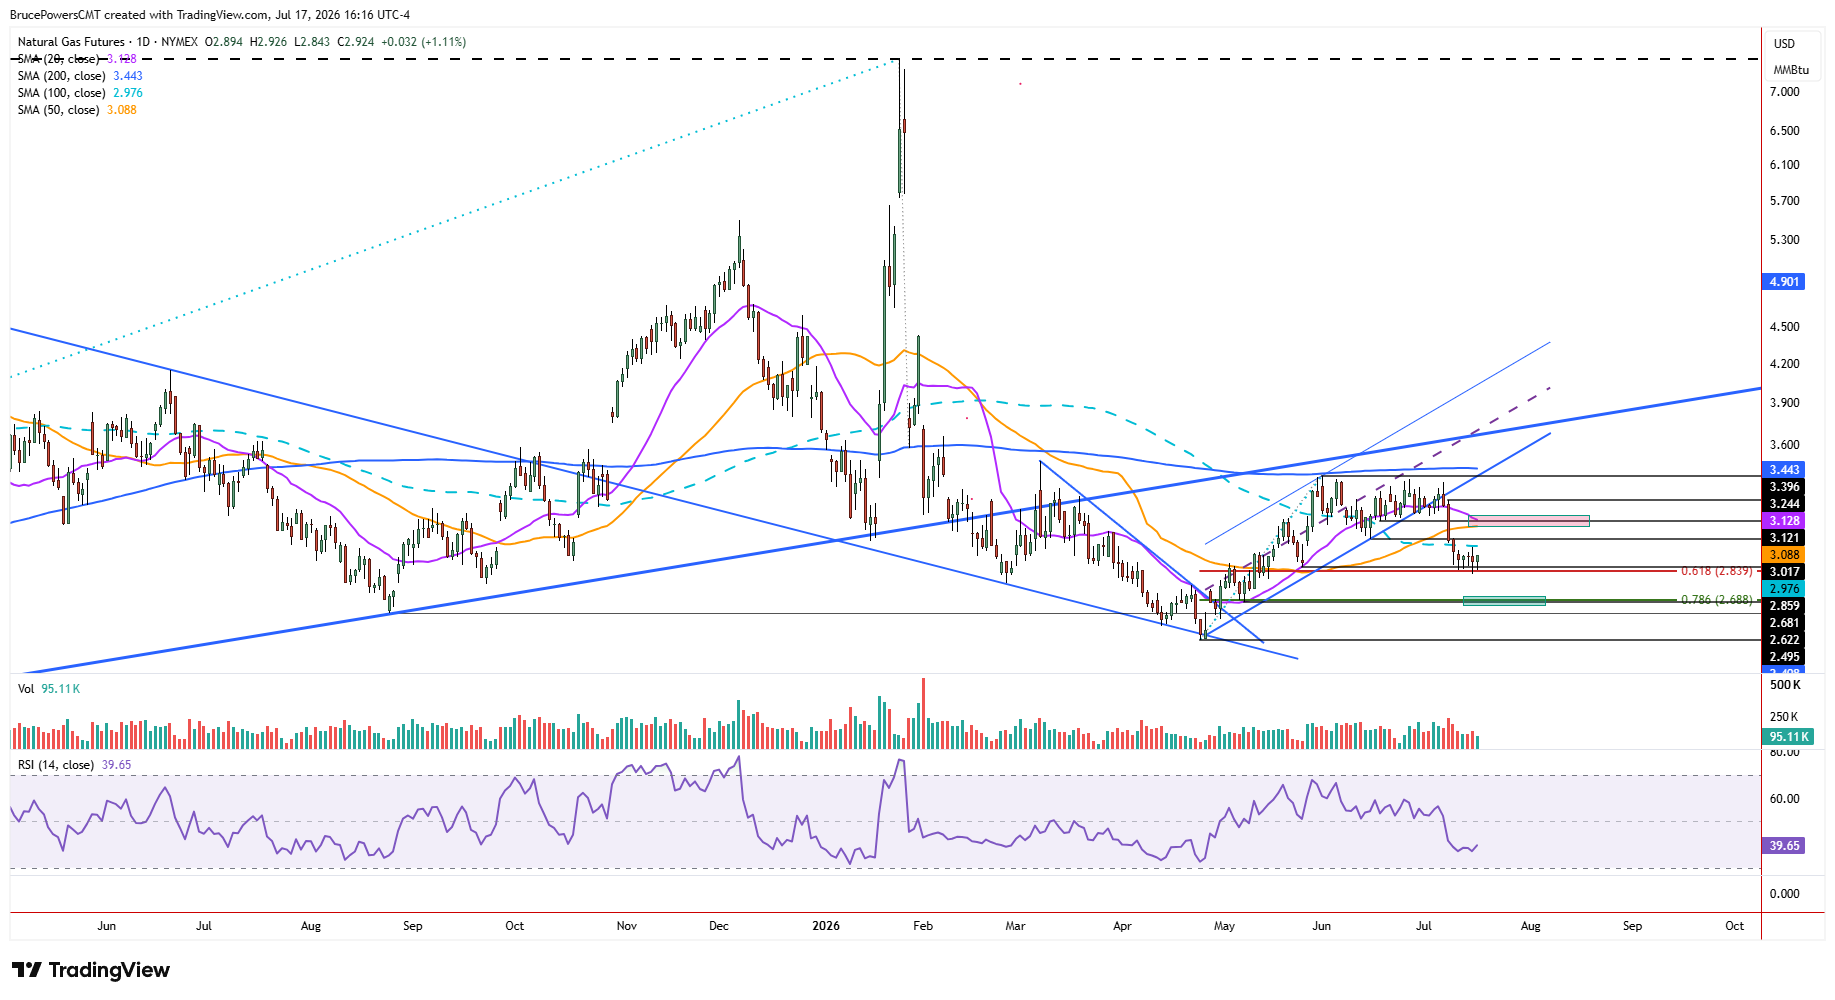
Given the recent lower swing high that was established at $3.40, followed by a break lower, the bearish trend structure of lower swing highs and lower swing lows looks poised to reassert itself to the downside. The recent bullish pullback successfully tested resistance near former support at the 200-day moving average, as well as a rising trendline.
Once prior support switches to resistance, a bearish trend may be ready to resume. Therefore, the current consolidation near the lows remains a critical decision point: either buyers reclaim key resistance levels and challenge the bearish structure, or sellers confirm that the broader downtrend remains intact by triggering a breakdown below support.
Natural Gas Price Forecast
Every new Natural Gas analysis as it publishes, today's technical signal and key levels, live price — on one page.
See all Natural Gas forecastsIf you’d like to know more about how to trade natural gas, please visit our educational area.