


Weakening Momentum Signals a Trend Shift
KLA Corporation (KLAC) is part of the semiconductor equipment and materials industry group, and its stock has been under pressure recently, alongside many of its peers. The company’s stock hit a peak of $307.37 two weeks ago, as volume spiked to its highest level in 63 weeks. This reinforced signs of trend exhaustion already evident in the price action, since that top week completed a bearish outside week, encompassing the range of the prior two weeks.
The weekly Relative Strength Index (RSI) oscillator confirmed weakening momentum, falling below the key 70 overbought threshold. Together, these signals suggested that buying momentum was fading after an extended advance, setting the stage for the correction that followed.
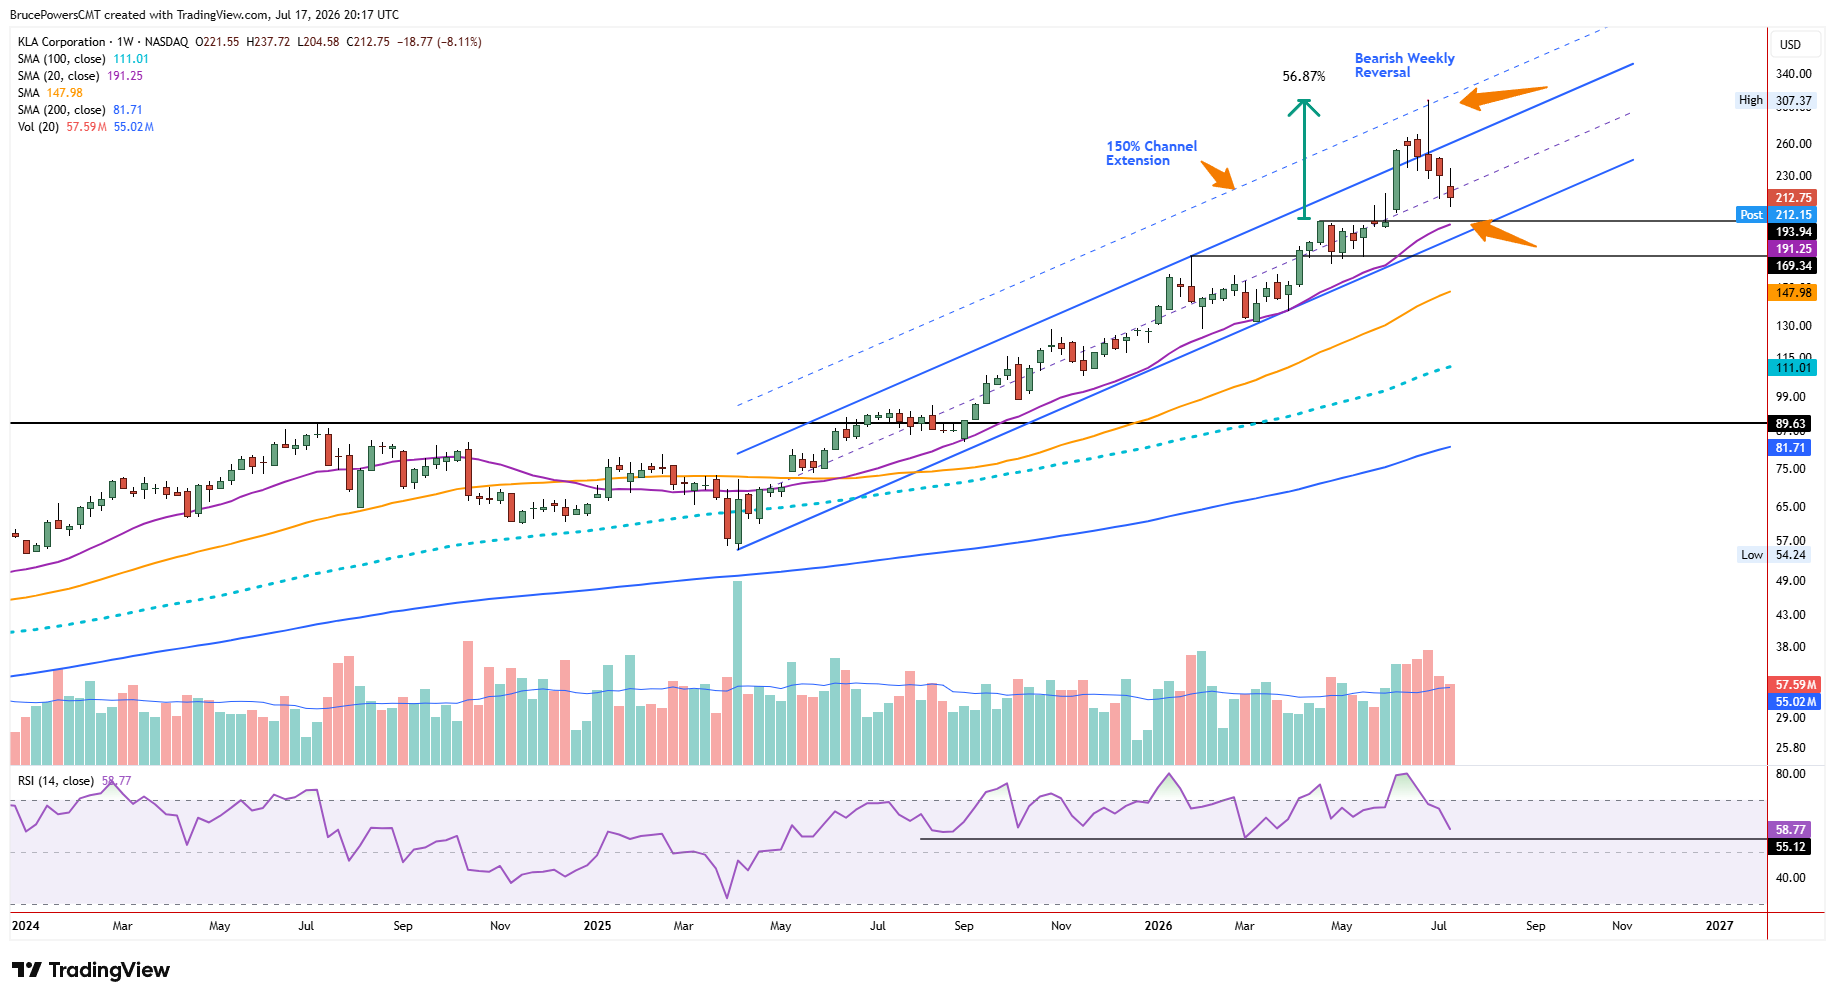
Given the decisive bearish response that followed the peak, it appears a key resistance level was reached. The high coincided with a 150% extension of a rising trend channel. Shortly after reaching that high, KLAC fell back into the channel formation and found support near the channel’s midline. This is the second time in recent weeks that buyers and sellers have recognized the channel’s structure, reinforcing its technical significance. This week, however, last week’s low of $210.86 was broken, confirming a decline below the channel midline.
Weekly Chart Points to Lower Support
Moreover, this week ended at $212.17, below the midline, further confirming downward pressure. Once the midline fails as support, the lower channel boundary becomes a potential target. At a minimum, this suggests further downside is likely during the current correction. Based on the weekly chart, the next lower target zone is near the prior trend high of $193.94 and the rising 20-week moving average, currently at $191.23.
Pennant Breakdown Strengthens the Bearish Case
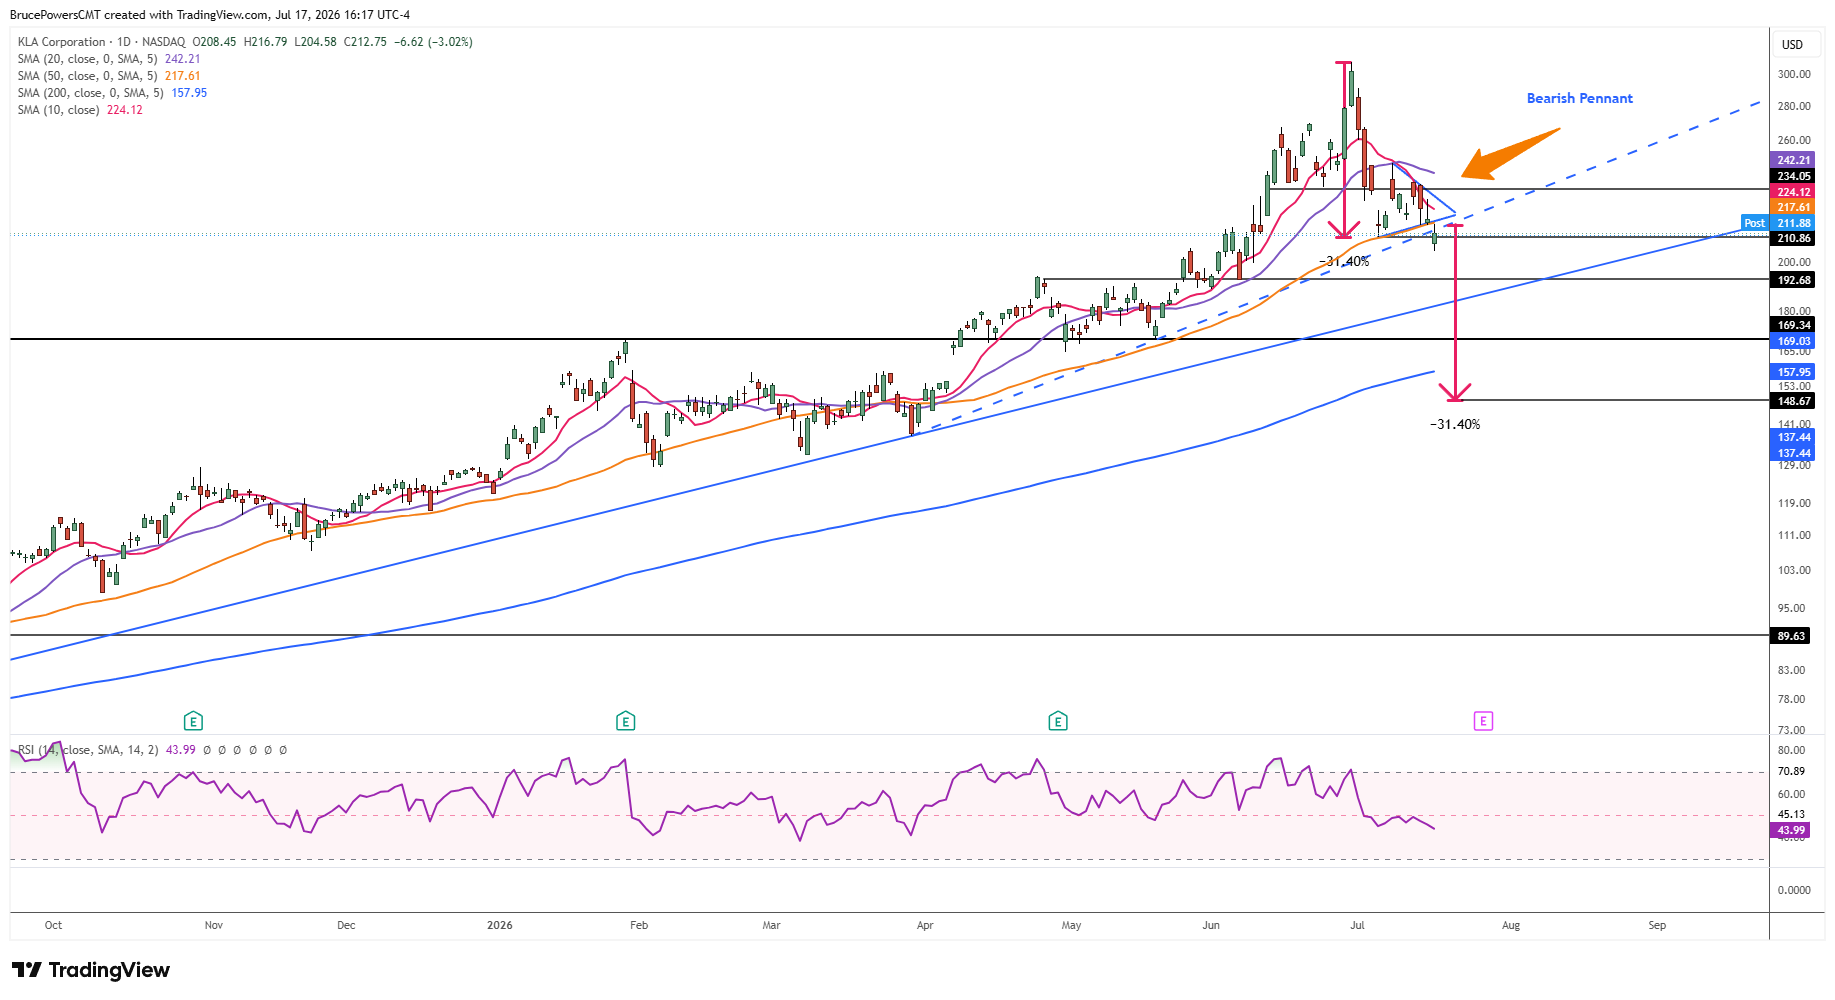
On the daily chart, the bearish picture becomes clearer. The first leg down from the peak found support at $210.86 before consolidating into a bearish pennant formation – a small symmetrical triangle. Support for the pattern was provided by the 50-day moving average, while resistance developed near the 10-day moving average. A breakdown from the pattern triggered on Friday, leading to a new retracement low of $204.58. Friday’s high of $216.79 also marked the first test of resistance near the 50-day moving average, at least so far. Adding to the bearish evidence, the pennant breakdown coincided with a break below a rising trendline, strengthening the bearish implications of the move.
A standard measured move for the pennant, which considers the sharp decline that preceded consolidation, points to a potential downside target near $148.67. Although this is only one factor used in evaluating potential downside targets, it reinforces the broader technical message that weakening momentum at the peak has evolved into a confirmed bearish correction, increasing the likelihood that KLAC will experience at least one more leg lower before a more durable bottom can form.
If you’d like to know more about technical analysis and how traders use it, please visit our educational area.