
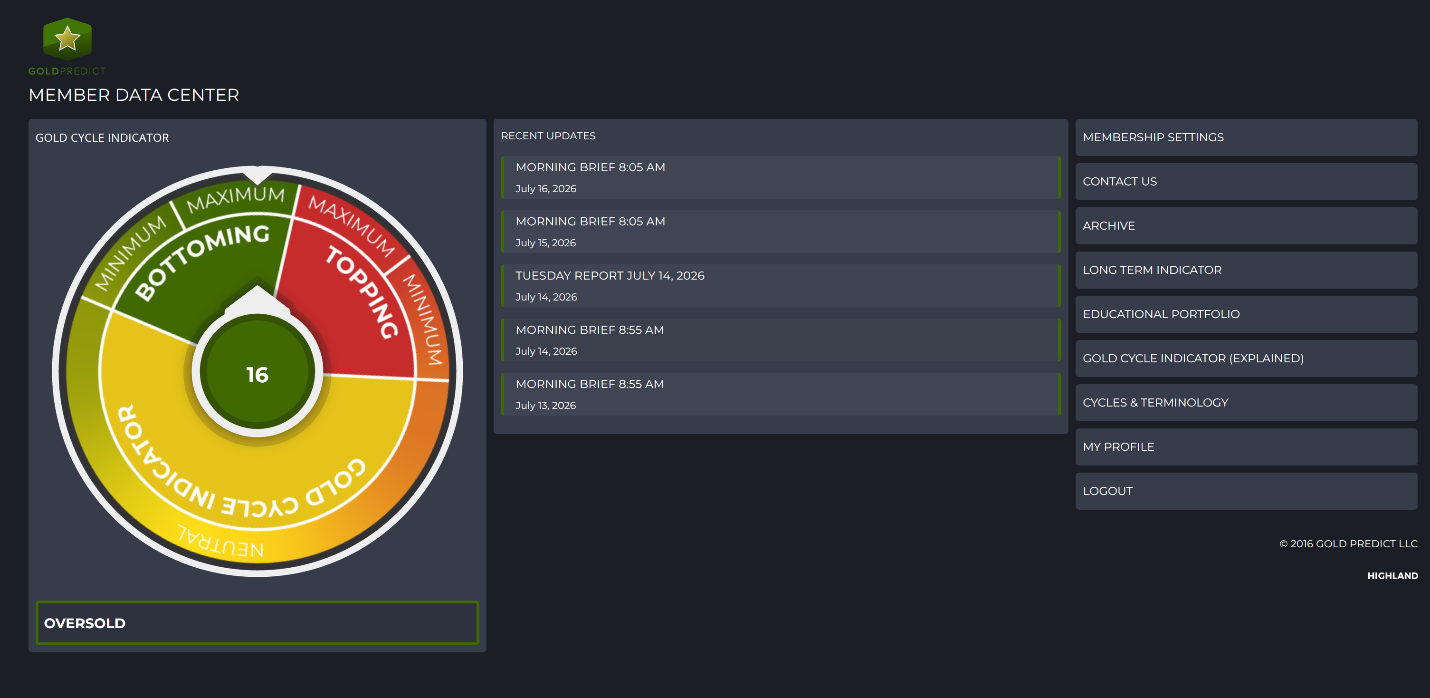
Our Gold Cycle Indicator is at 16; the most oversold since late 2022.

US Dollar
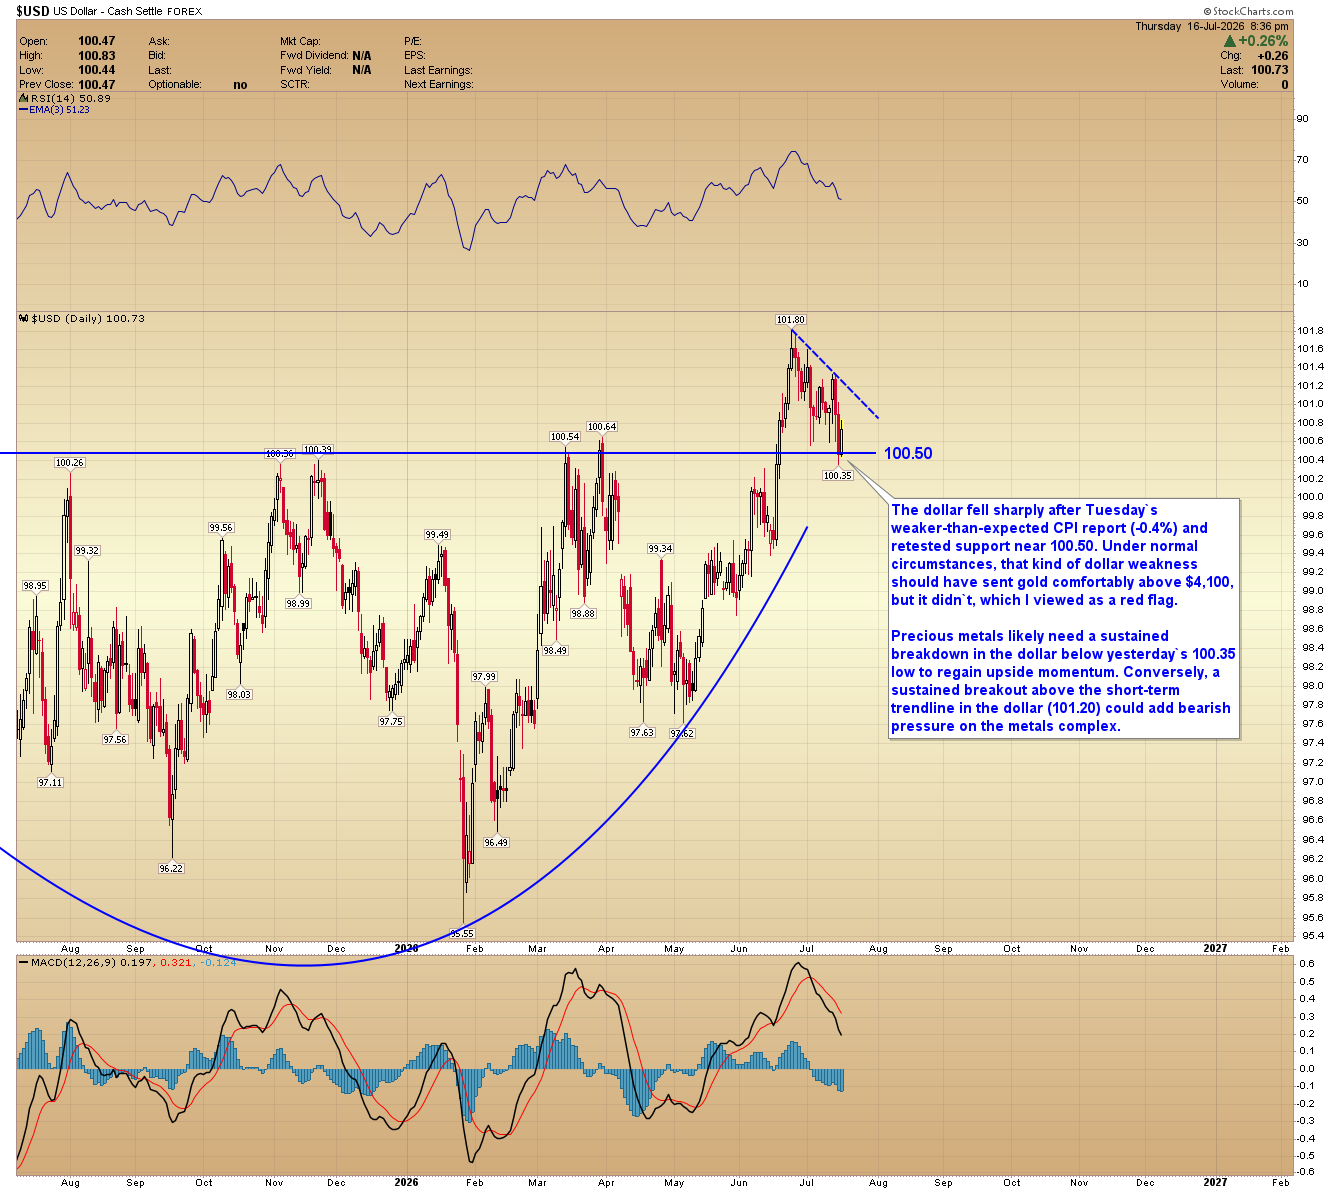
The dollar fell sharply after Tuesday’s weaker-than-expected CPI report (-0.4%) and retested support near 100.50. Under normal circumstances, that kind of dollar weakness should have sent gold comfortably above $4,100, but it didn’t, which I viewed as a red flag.
Precious metals likely need a sustained breakdown in the dollar below yesterday’s 100.35 low to regain upside momentum. Conversely, a sustained breakout above the short-term trendline in the dollar (101.20) could add bearish pressure on the metals complex.
Gold
Gold posted a fresh closing low as we approach the end of the expected timing window. The weaker-than-expected CPI report and the resulting dollar weakness should have been enough to push gold well-above $4,100, but that failed to materialize. To me, that suggests the recent weakness has more to do with renewed tensions surrounding Iran.
The $3,900 level remains my line in the sand. It would take a sustained breakdown lasting more than three days below that level to activate my alternate downside target of $3,500-$3,600. Until then, I continue to watch for evidence that a meaningful bottom is forming.
Gold Price Forecast
Every new Gold analysis as it publishes, today's technical signal and key levels, live price — on one page.
See all Gold forecasts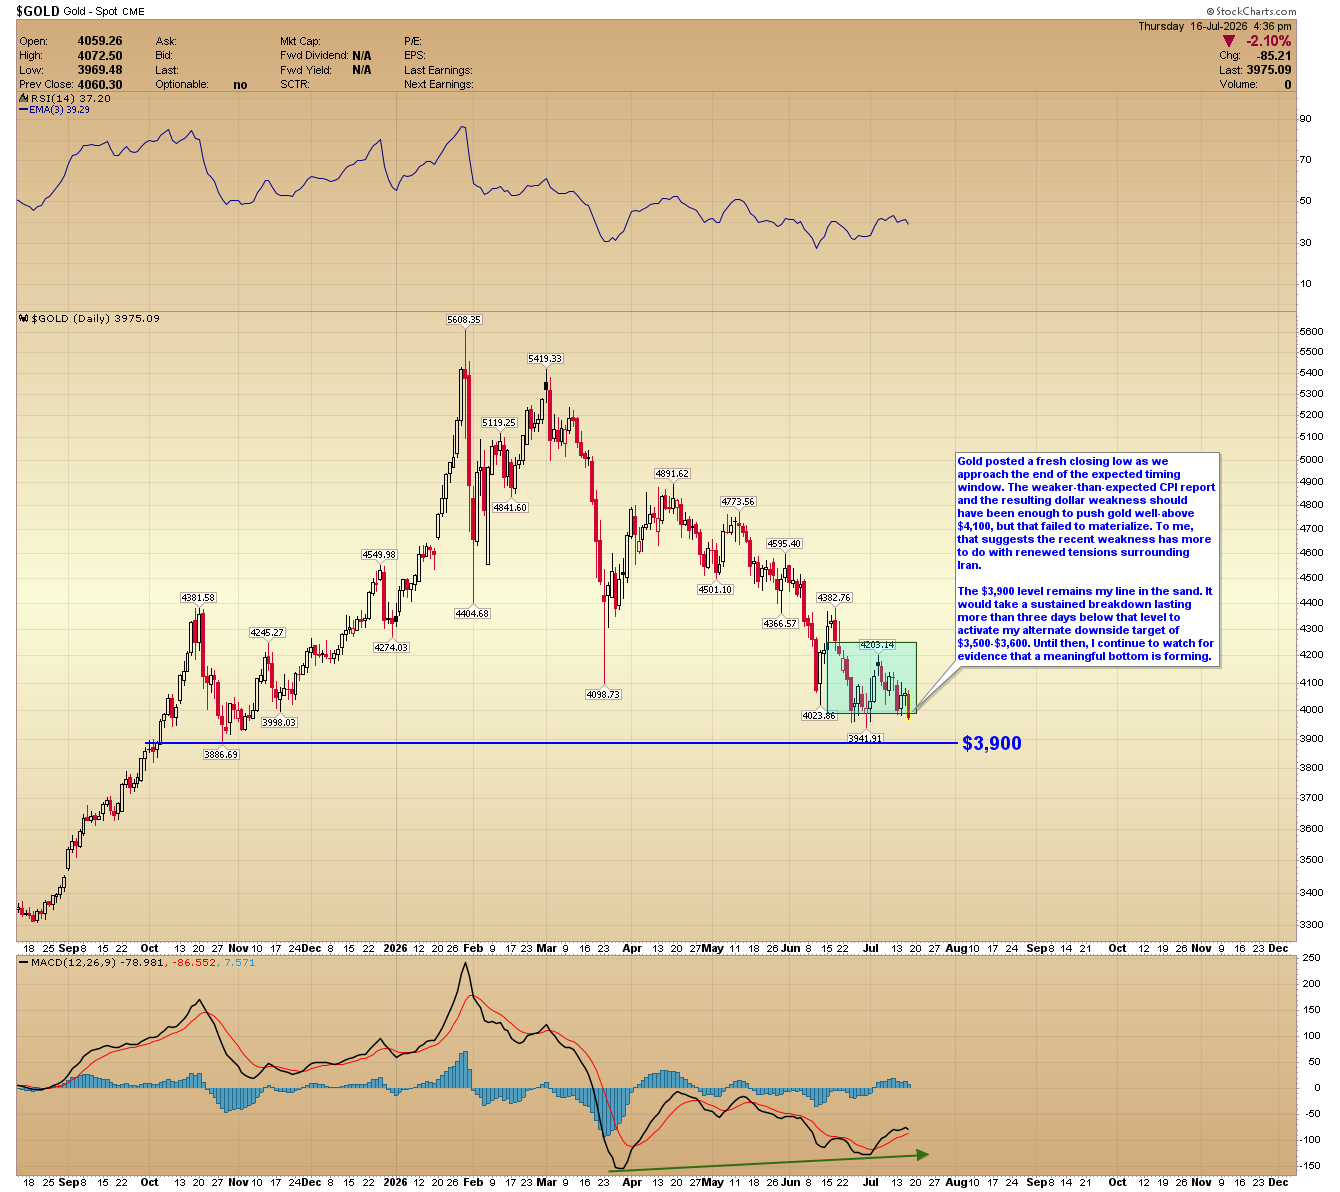
Silver
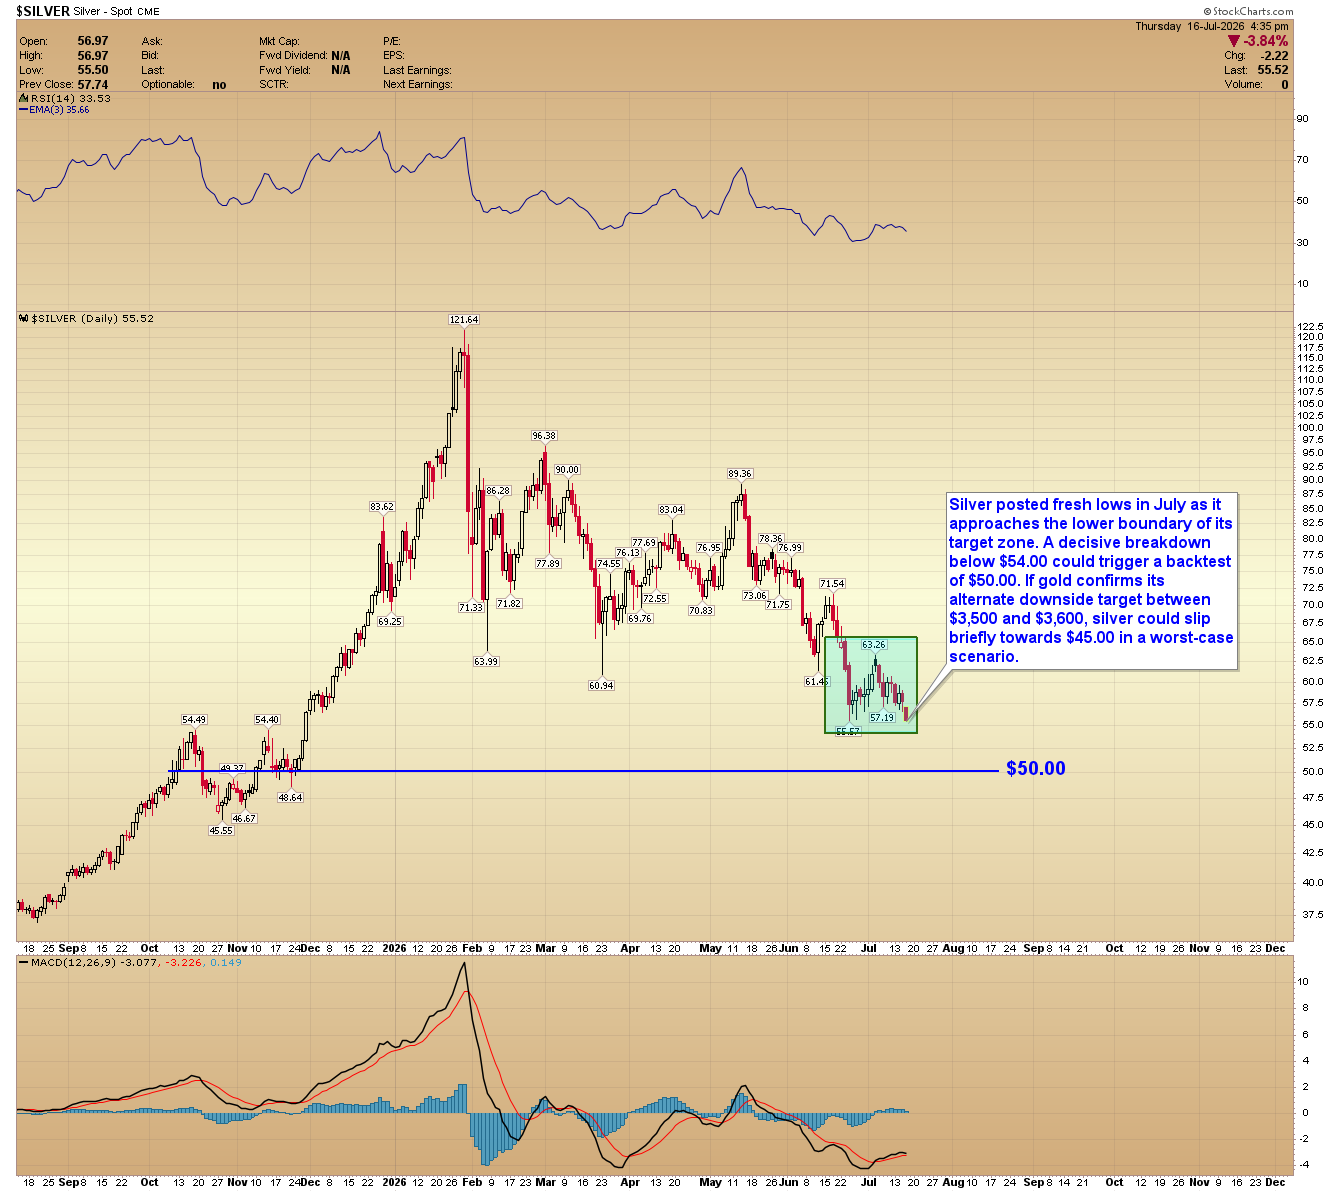
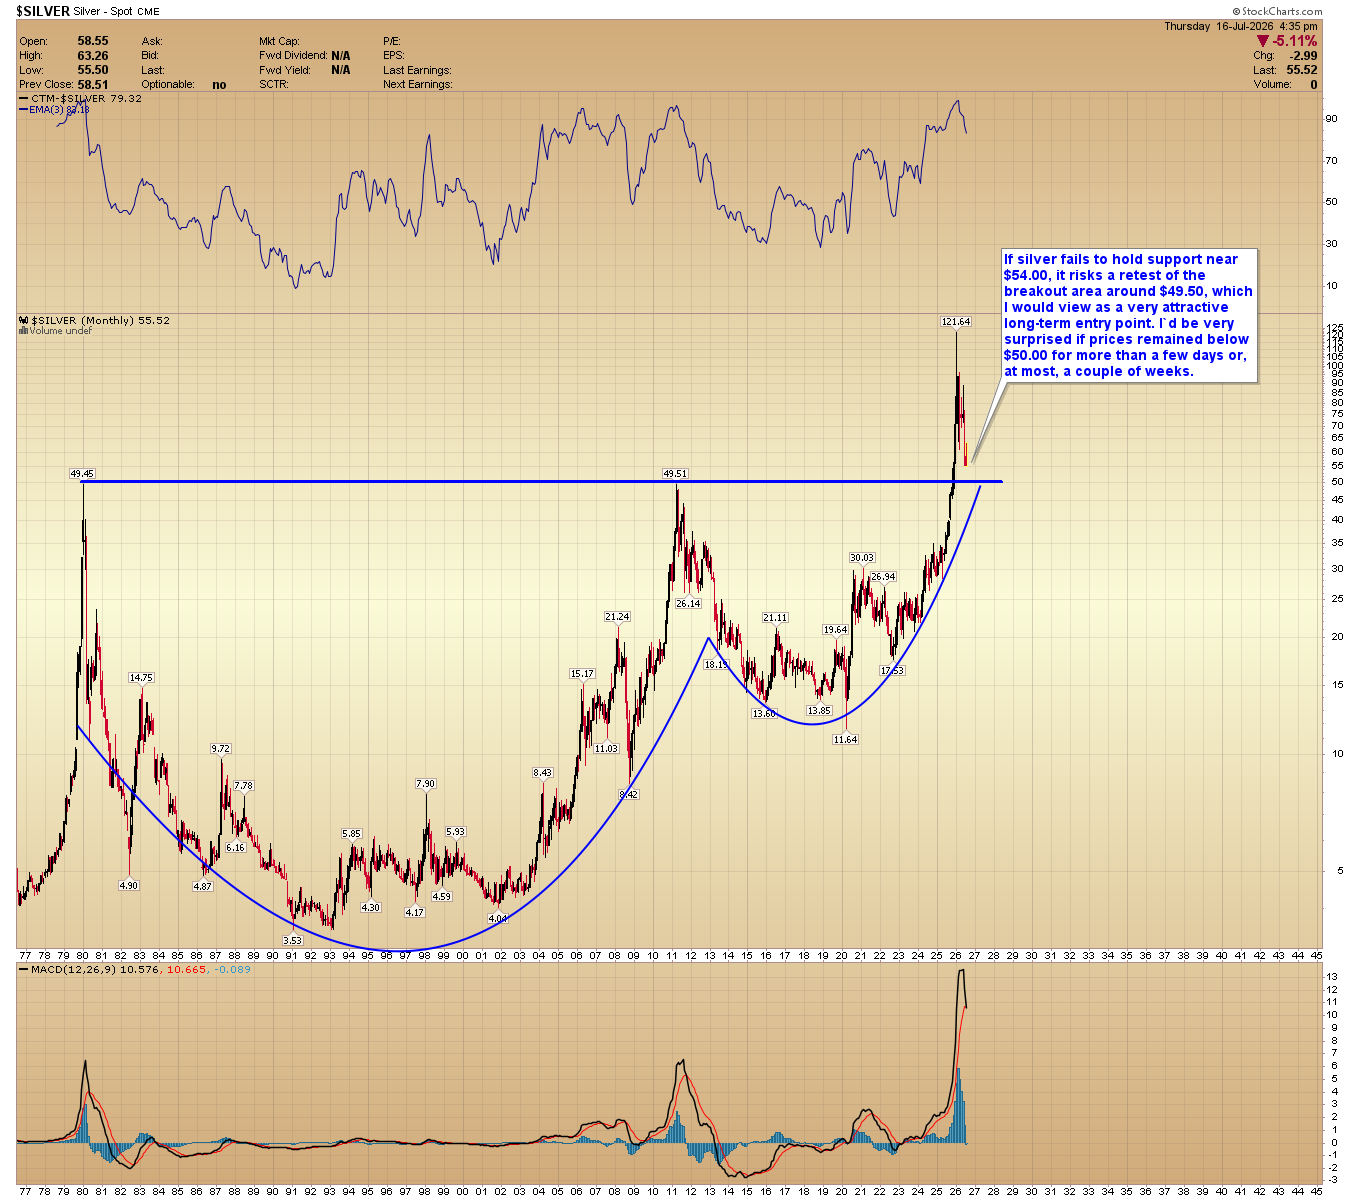
Silver posted fresh lows in July as it approaches the lower boundary of its target zone. A decisive breakdown below $54.00 could trigger a backtest of $50.00. If gold confirms its alternate downside target between $3,500 and $3,600, silver could slip briefly towards $45.00 in a worst-case scenario.
Silver Monthly
If silver fails to hold support near $54.00, it risks a retest of the breakout area around $49.50, which I would view as a very attractive long-term entry point. I’d be very surprised if prices remained below $50.00 for more than a few days or, at most, a couple of weeks.
Platinum
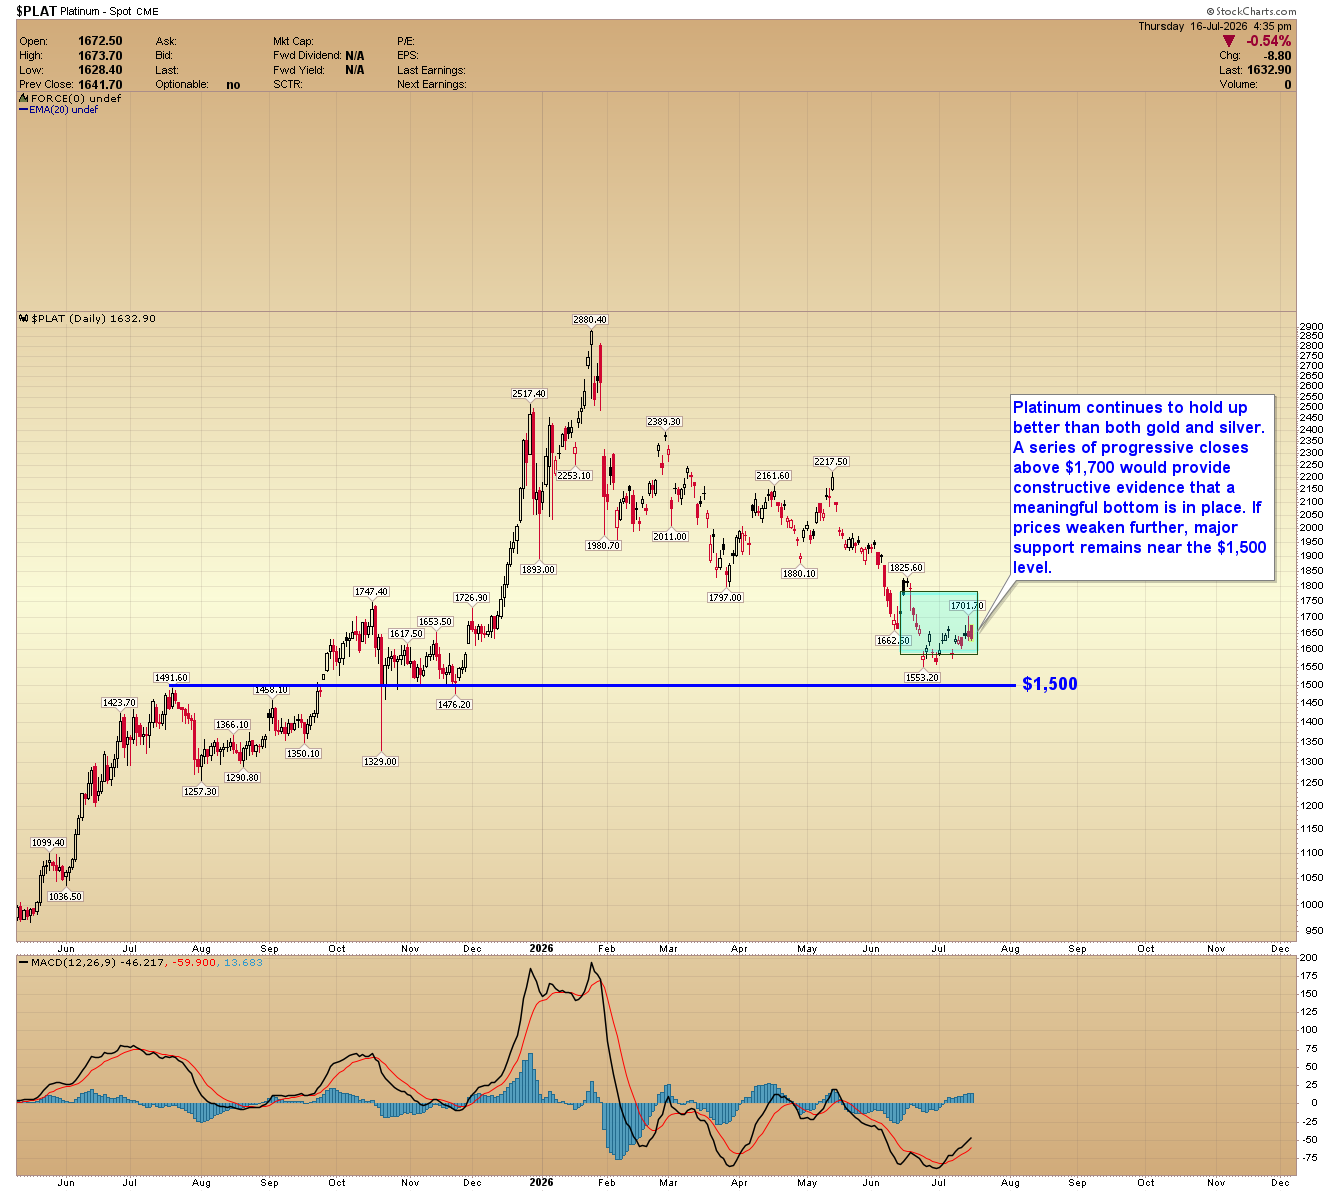
Platinum continues to hold up better than both gold and silver. A series of progressive closes above $1,700 would provide constructive evidence that a meaningful bottom is in place. If prices weaken further, major support remains near $1,500.
GDX
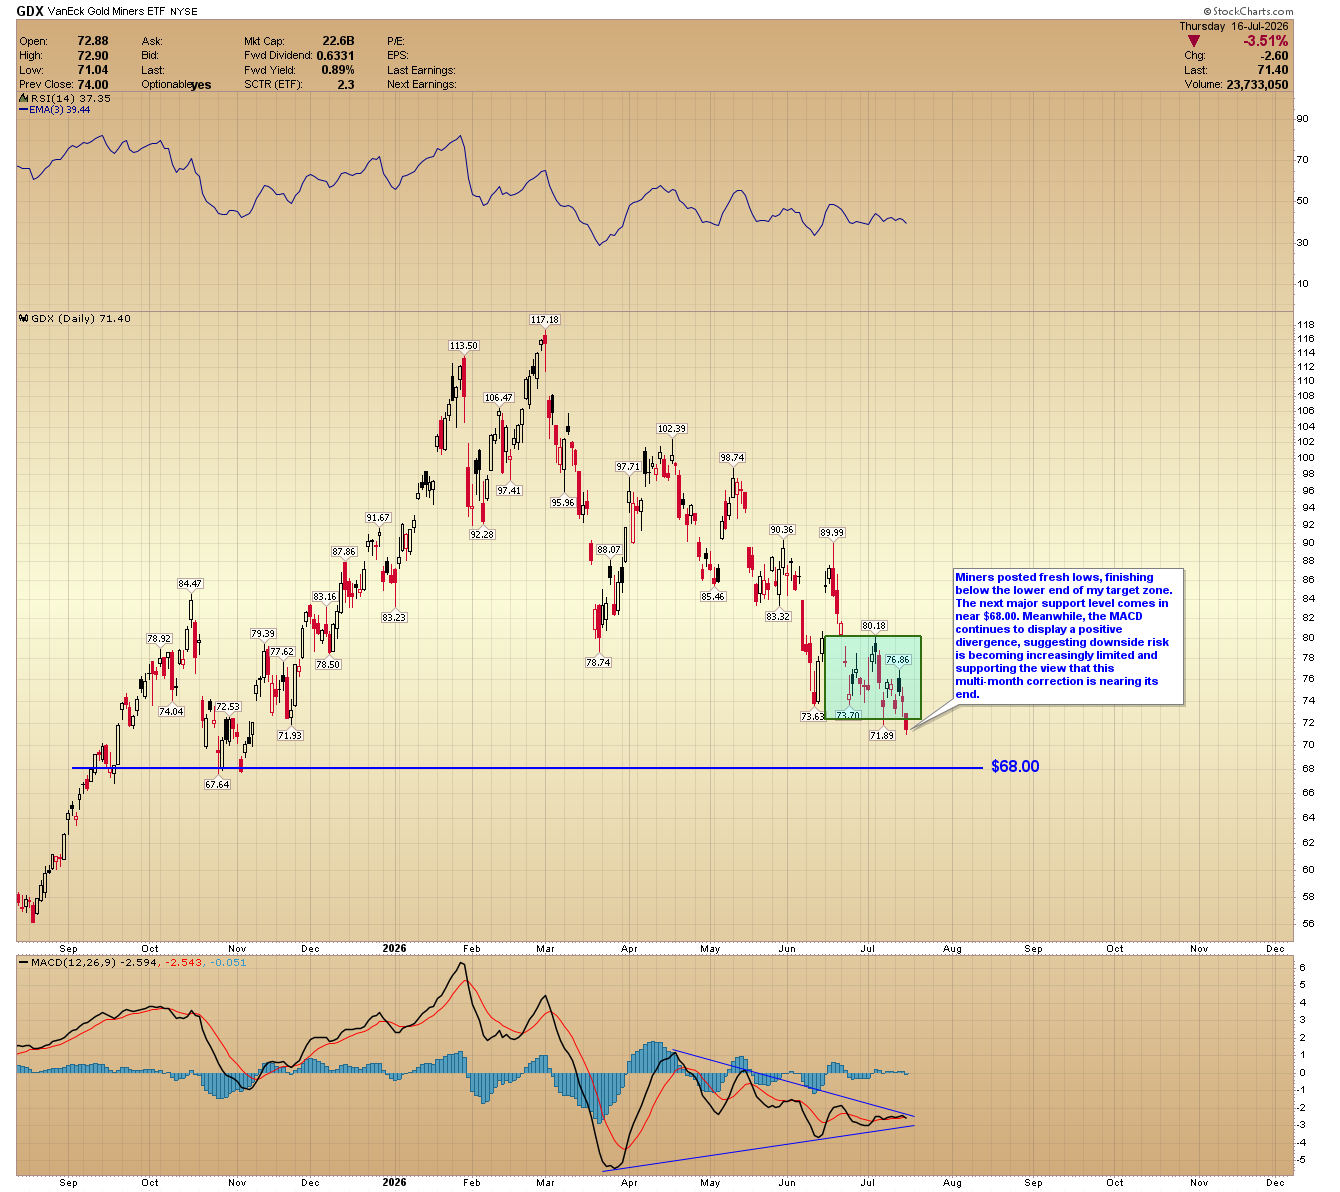
Miners posted fresh lows, finishing below the lower end of my target zone. The next major support level comes in near $68.00. Meanwhile, the MACD continues to display a positive divergence, suggesting downside risk is becoming increasingly limited and supporting the view that this multi-month correction is nearing its end.
GDXJ
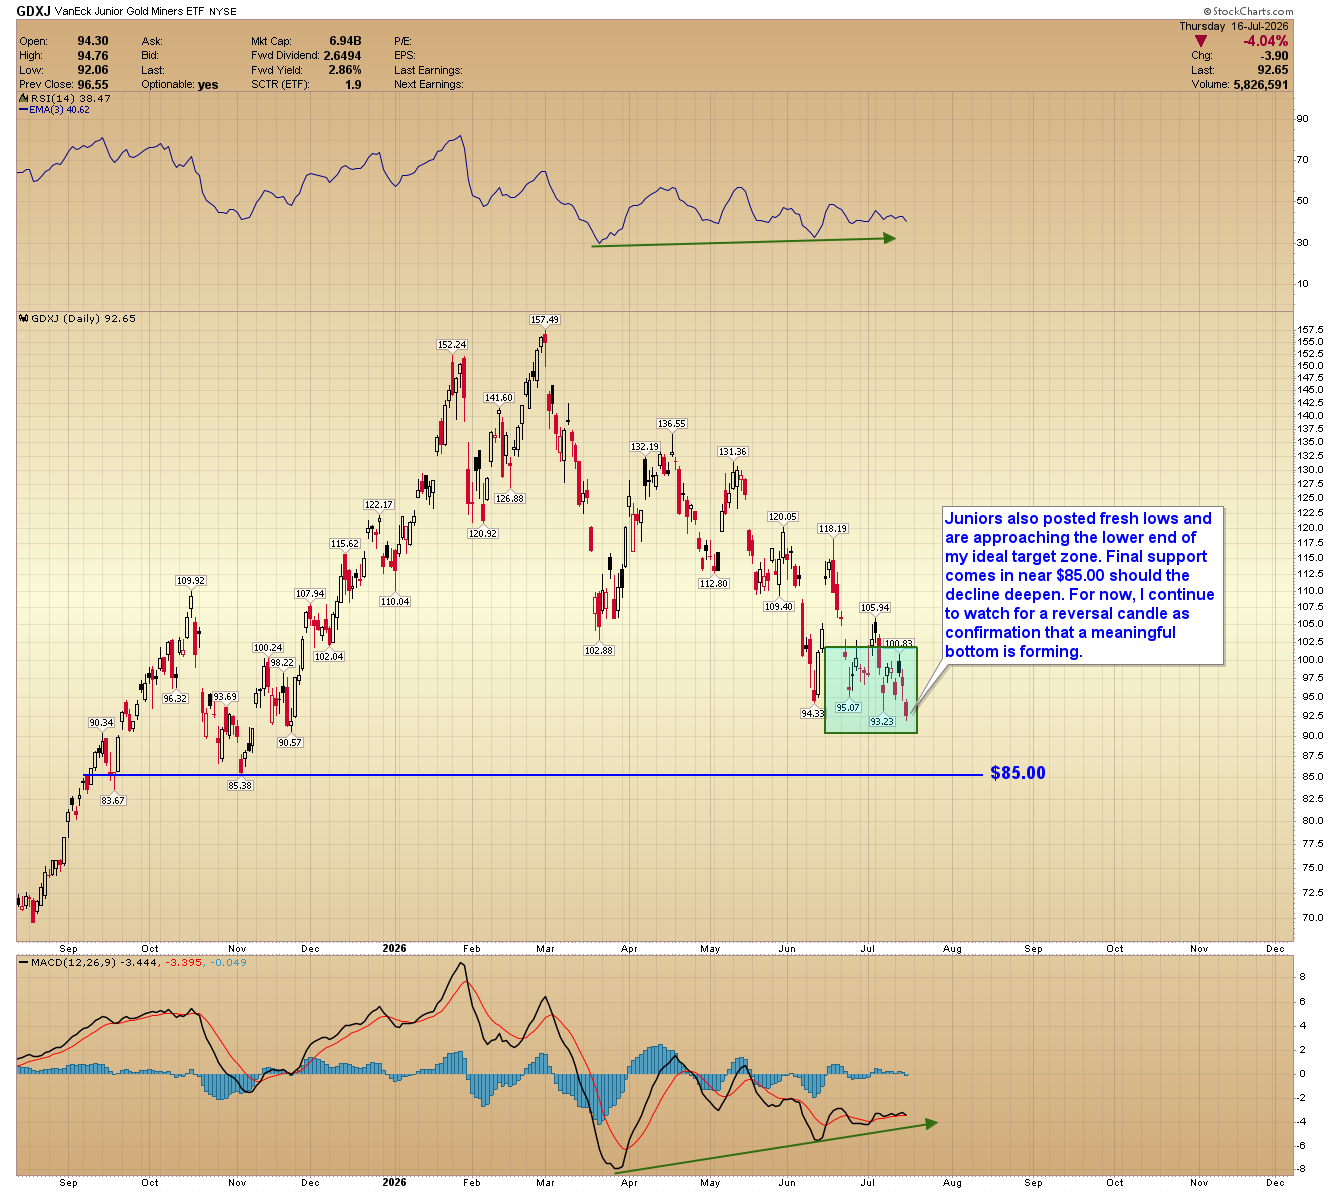
Juniors also posted fresh lows and are approaching the lower end of my ideal target zone. Final support comes in near $85.00 should the decline deepen. For now, I continue to watch for a reversal candle as confirmation that a meaningful bottom is forming.
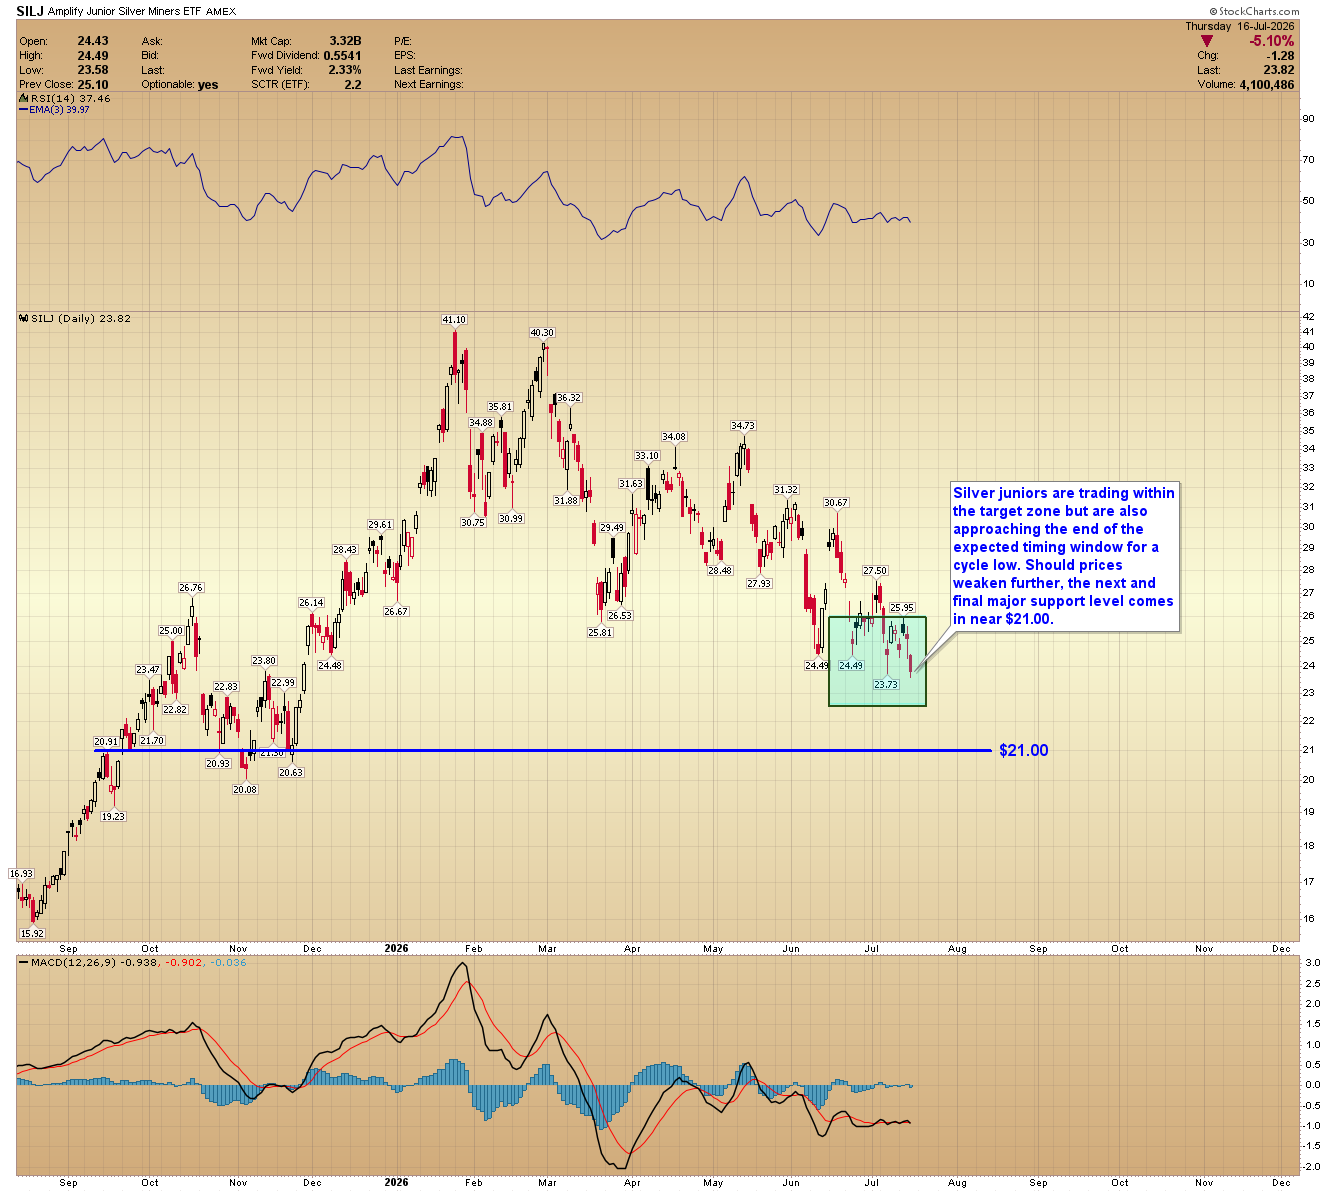
SILJ
Silver juniors are trading within the target zone but are also approaching the end of the expected timing window for a cycle low. Should prices weaken further, the next and final major support level comes in near $21.00.
Conclusion
Tuesday’s -0.4% CPI print and the weaker U.S. dollar should have been enough to push gold higher, reinforcing the case that a mid-year low was already in place. The fact that it didn’t suggests other bearish forces remain at work and could drive prices lower before a final bottom is established.
Overall, I continue to believe the correction that began in January is approximately 95% complete and that we are approaching an important low. However, if gold fails to hold the $3,900 level through July, I will have to acknowledge the possibility of a deeper decline towards $3,500. Under that scenario, silver could temporarily fall to around $45.00.
The bigger picture remains unchanged. I view the current correction as just a pause within a multi-year bull market that should extend into 2030, with gold ultimately surpassing $10,000 and silver rising above $300. In the near term, however, bearish sentiment appears to be reaching an extreme, suggesting we are probably closer to a bottom than most investors likely expect.
AG Thorson is a registered CMT and an expert in technical analysis. For more price predictions and daily market commentary, consider subscribing at www.GoldPredict.com.