NASDAQ 100 Technical Analysis
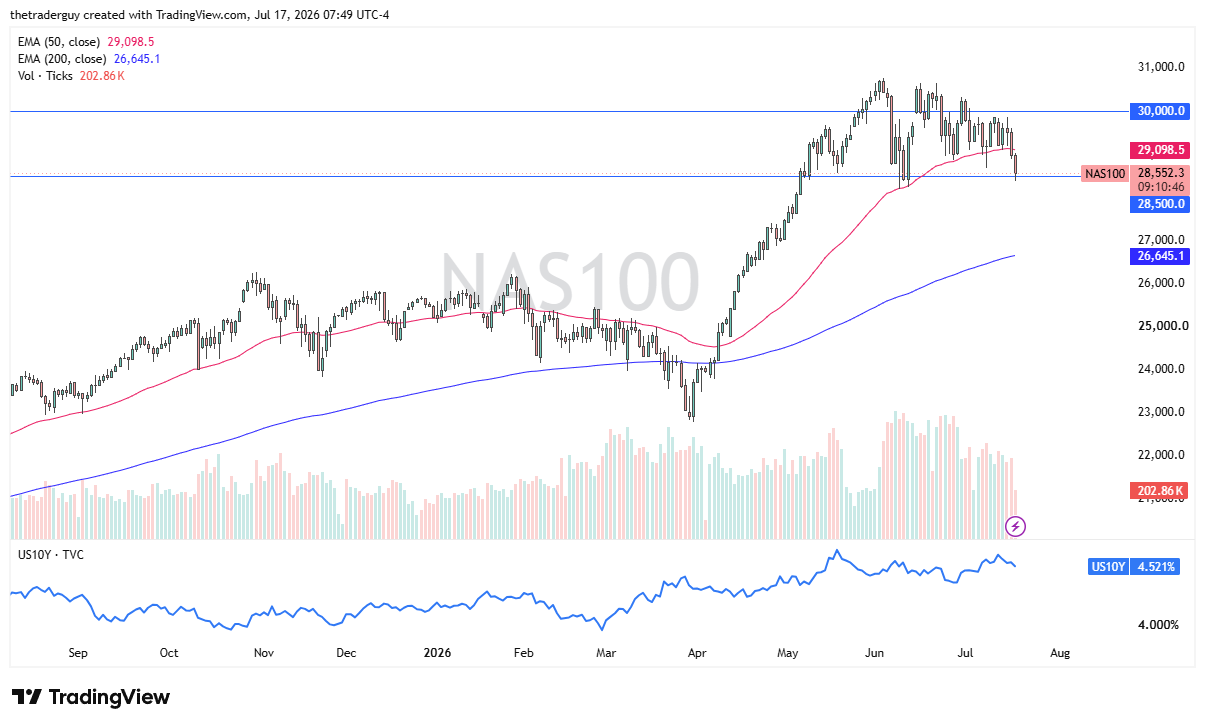
The NASDAQ 100 fell to kick off the overnight Friday session. That being said, we are hanging around the 28,500 level. This is an area that previously had been supported, so it’ll be interesting to see whether or not that is an area that a lot of people will pay attention to. A bounce from here opens up the possibility of some type of continuation of the consolidation. If the market were to break down below the 28,200 level, the latest swing low, one would have to assume that the sellers are asserting their influence.

Dow Jones 30 Technical Analysis
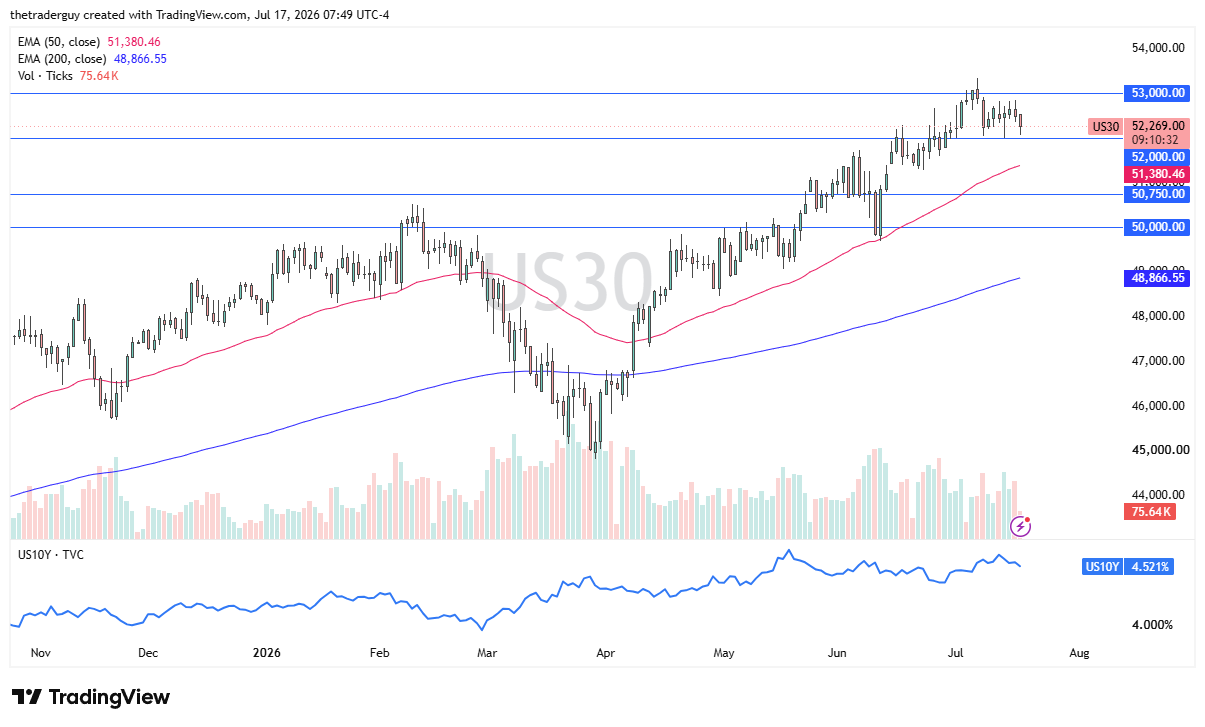
The Dow Jones 30 fell initially during the session, but it seems as if it is trying to turn things around and show signs of life again, so the 52,000 level continues to be an area that we will look at through the prism of a potential support level. As we bounce, it could send this market back into the same area we’ve been in, which, quite frankly, wouldn’t be a huge surprise; it would just be more of the same action.
S&P 500 Technical Analysis
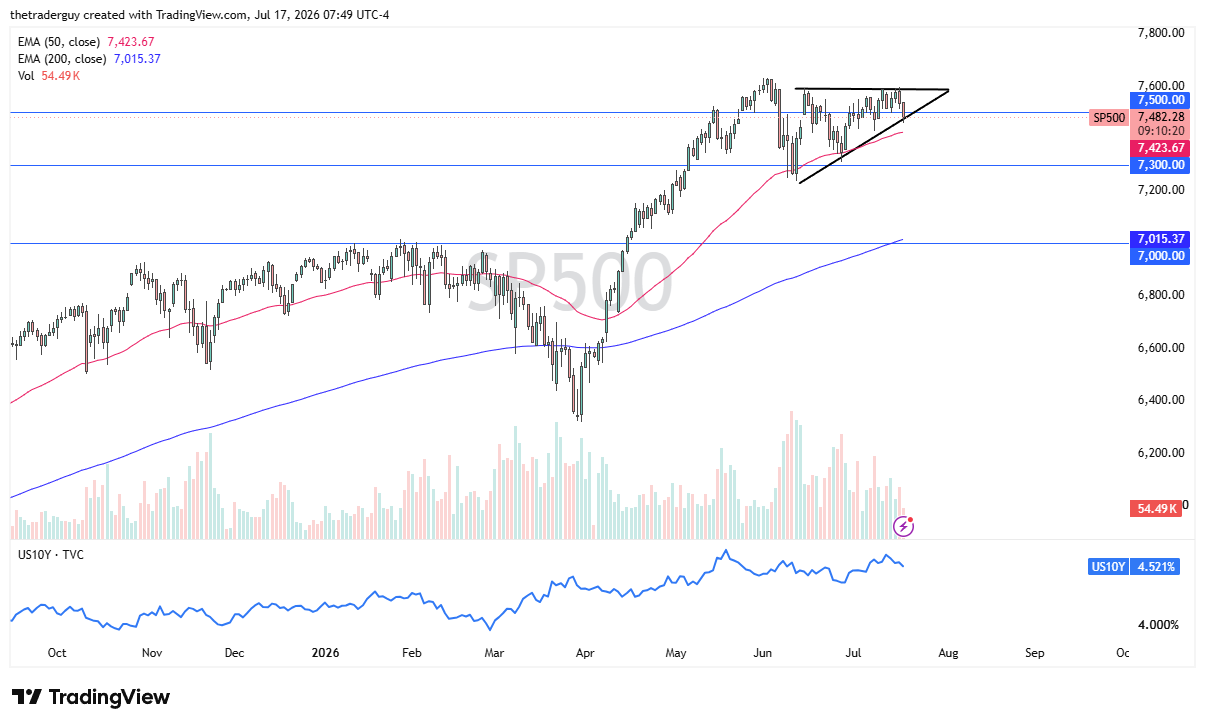
The S&P 500 fell to test the uptrend line of the ascending triangle that we had been trying to form, and at this point, it’s very likely that traders are going to continue to watch to see if the S&P 500 could get a little bit of a bounce. If it can, then re-entering the triangle makes quite a bit of sense. It’ll be interesting to see how this plays out because, as we head into the weekend, traders will have to take into account that the situation in Iran is not getting better, but at the same time, interest rates are dropping.
If you’d like to know more about technical analysis and how traders use it, please visit our educational area.