


TSLA Technical Analysis
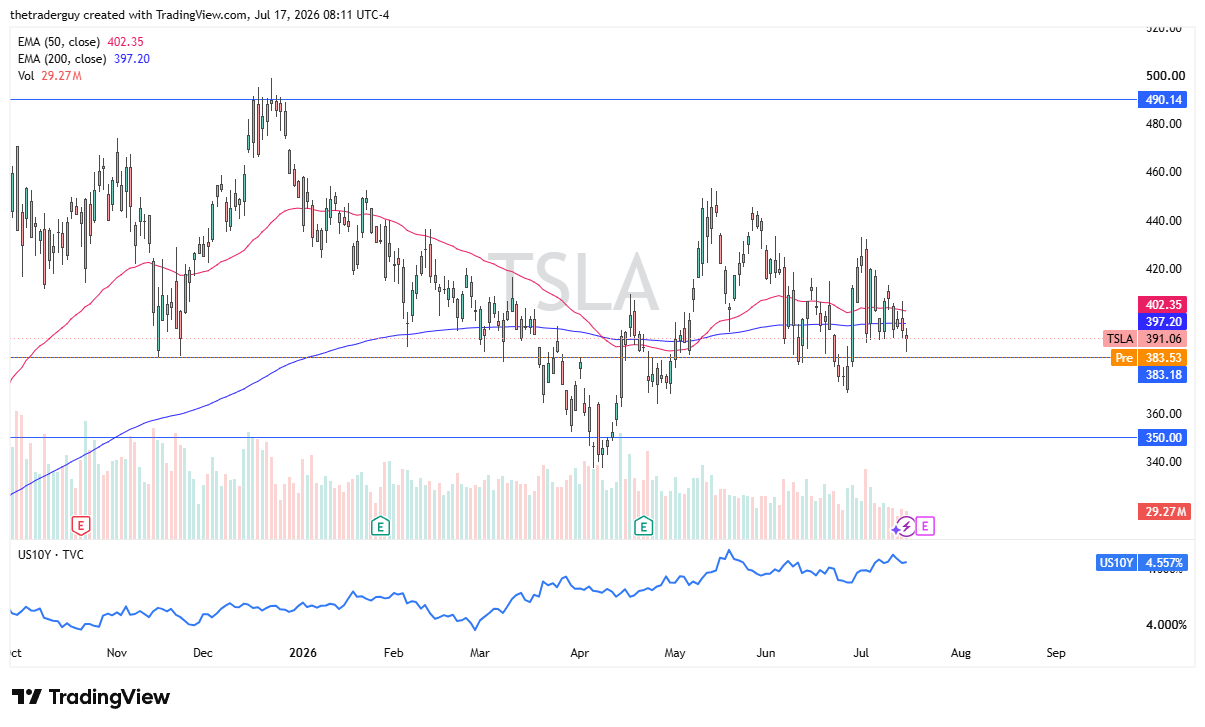
Tesla looks like it’s going to gap to the downside at the open on Friday as we continue to see risk appetite a little bit threatened by the conflict in the Middle East. And of course, we are approaching earnings season, so it’ll be interesting to see how that plays out.
Tesla has earnings next Wednesday and now finds itself threatening the $383 region, an area that’s been important multiple times in the past. It’ll be interesting to see if there’s any type of pushback here from the buyers. All things being equal, the market has been somewhat sideways for the better part of a year as we are just trying to figure out where to go next.
SPCX Technical Analysis
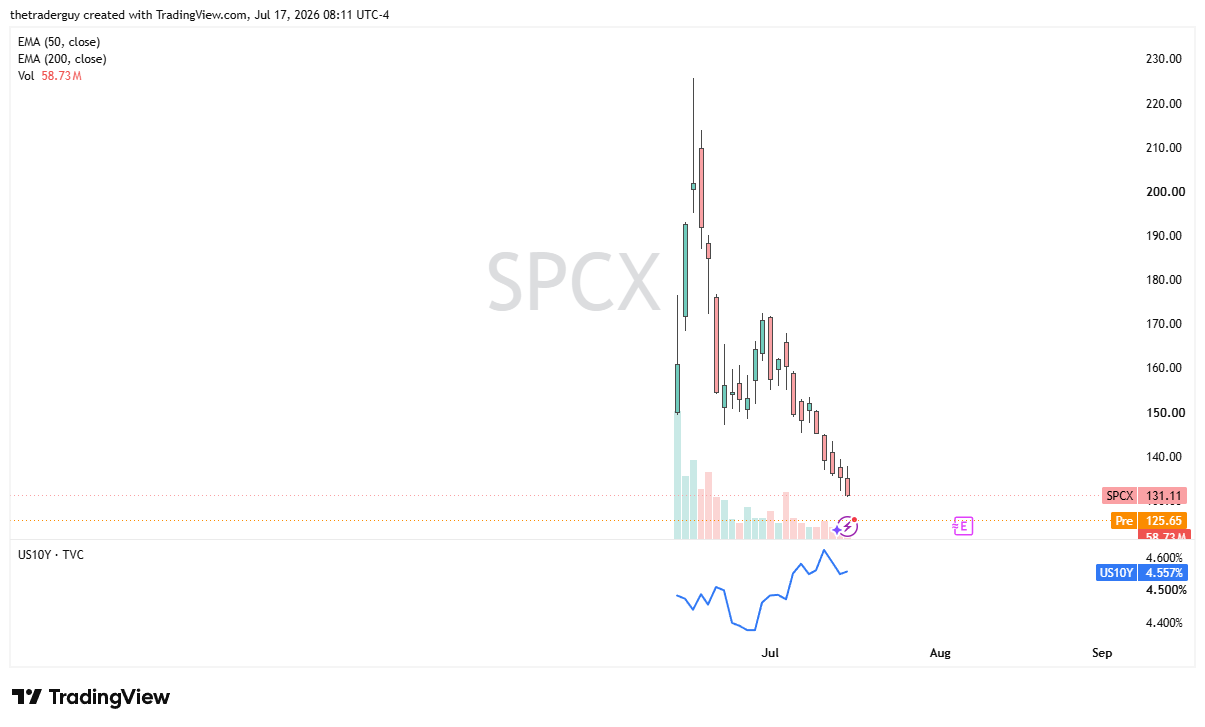
SpaceX looks very weak early during the trading session on Friday, as we are looking at a gap lower to continue the bloodbath that has been a major factor here. The bottom cannot really be quantified yet because there is no historical price action. One thing is for certain: there are people out there who would love to own this company, but finding the right price is the catch. After all, it is an extraordinarily risky business, and we do not get an earnings call or any guidance until the 6th of August.
With that being said, this is one that is worth watching. It could be a generational investment; we just don’t know. Certainly, it’s a very exciting field, but as things stand right now, it looks like nobody’s willing to pay some of the original exorbitant prices, and as a result, it’s a matter of patience.
META Technical Analysis
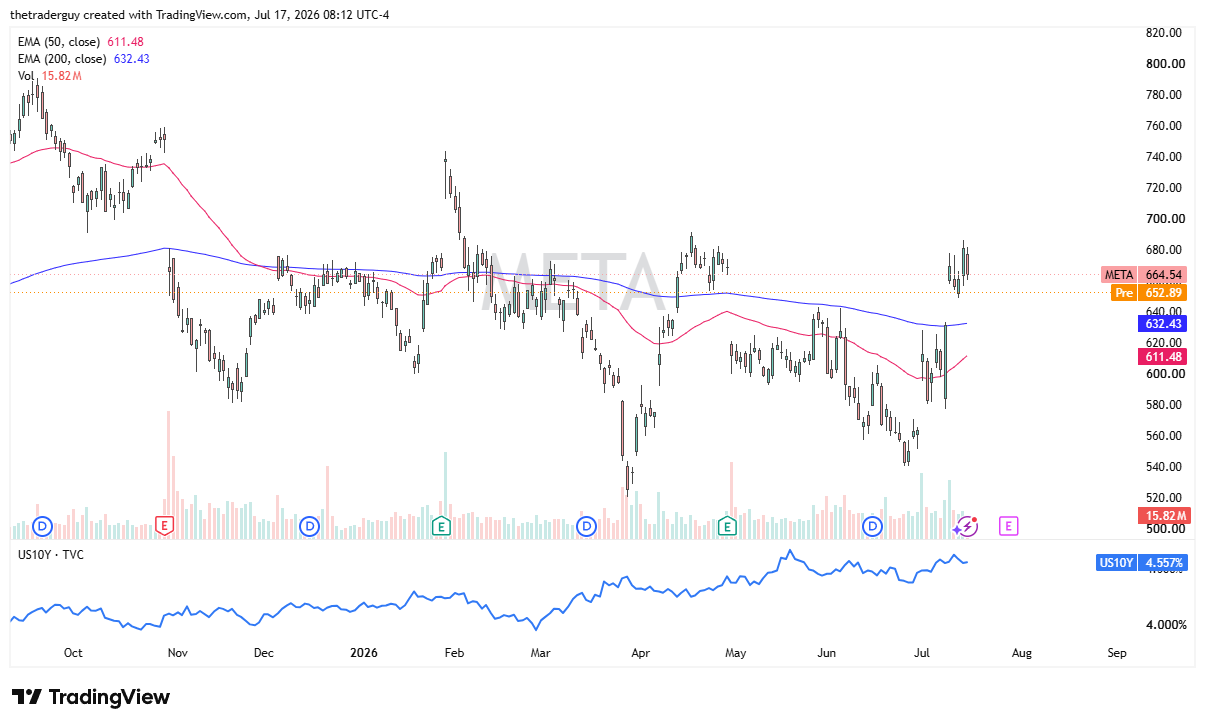
Meta looks like it’s going to gap lower at the open on Friday as traders continue to send this market back and forth. The 200-day EMA sits at $632. Meta has been pretty sideways for several months as well. Got a little stretched, looks like it’s giving some of that back.
There are concerns about the global economy and, of course, the tech trade in general. The earnings call is on the 29th, so we have a little bit of time between now and then to fill the gap. We would have to test that 200-day EMA. So who knows, that could be an area where people are willing to get involved. This is a market that continues to see a lot of resistance near $690, which is basically where we’re rolling back from this time as well.
If you’d like to know more about technical analysis and how traders use it, please visit our educational area.