



Chip Selling Pushes S&P 500 Toward a Losing Week
The chip selloff is running into a third day and dragging the S&P 500 toward its first losing week in three. The VanEck Semiconductor ETF is down more than 4% Friday and has lost over 17% this month. China’s Moonshot AI added a new problem by introducing a model it says competes with OpenAI and Anthropic, giving traders another reason to question whether U.S. companies can justify what they are spending. Oil above $81 WTI and $86 Brent on the Iran escalation is keeping rate pressure on the same growth stocks taking the heaviest selling.
At 17:34 GMT, the S&P 500 Index is trading 7482.57, down 51.20 or -0.68%. The Nasdaq Composite Index is at 25595.529, down 286.417 or -1.11% and the Dow is trading 52374.52, down 178.45 or -0.34%.
The S&P 500 is down more than 1% for the week. The Nasdaq has lost over 2%. The Dow is roughly flat, confirming the damage is concentrated in technology.
Daily S&P 500 Index Technical Analysis
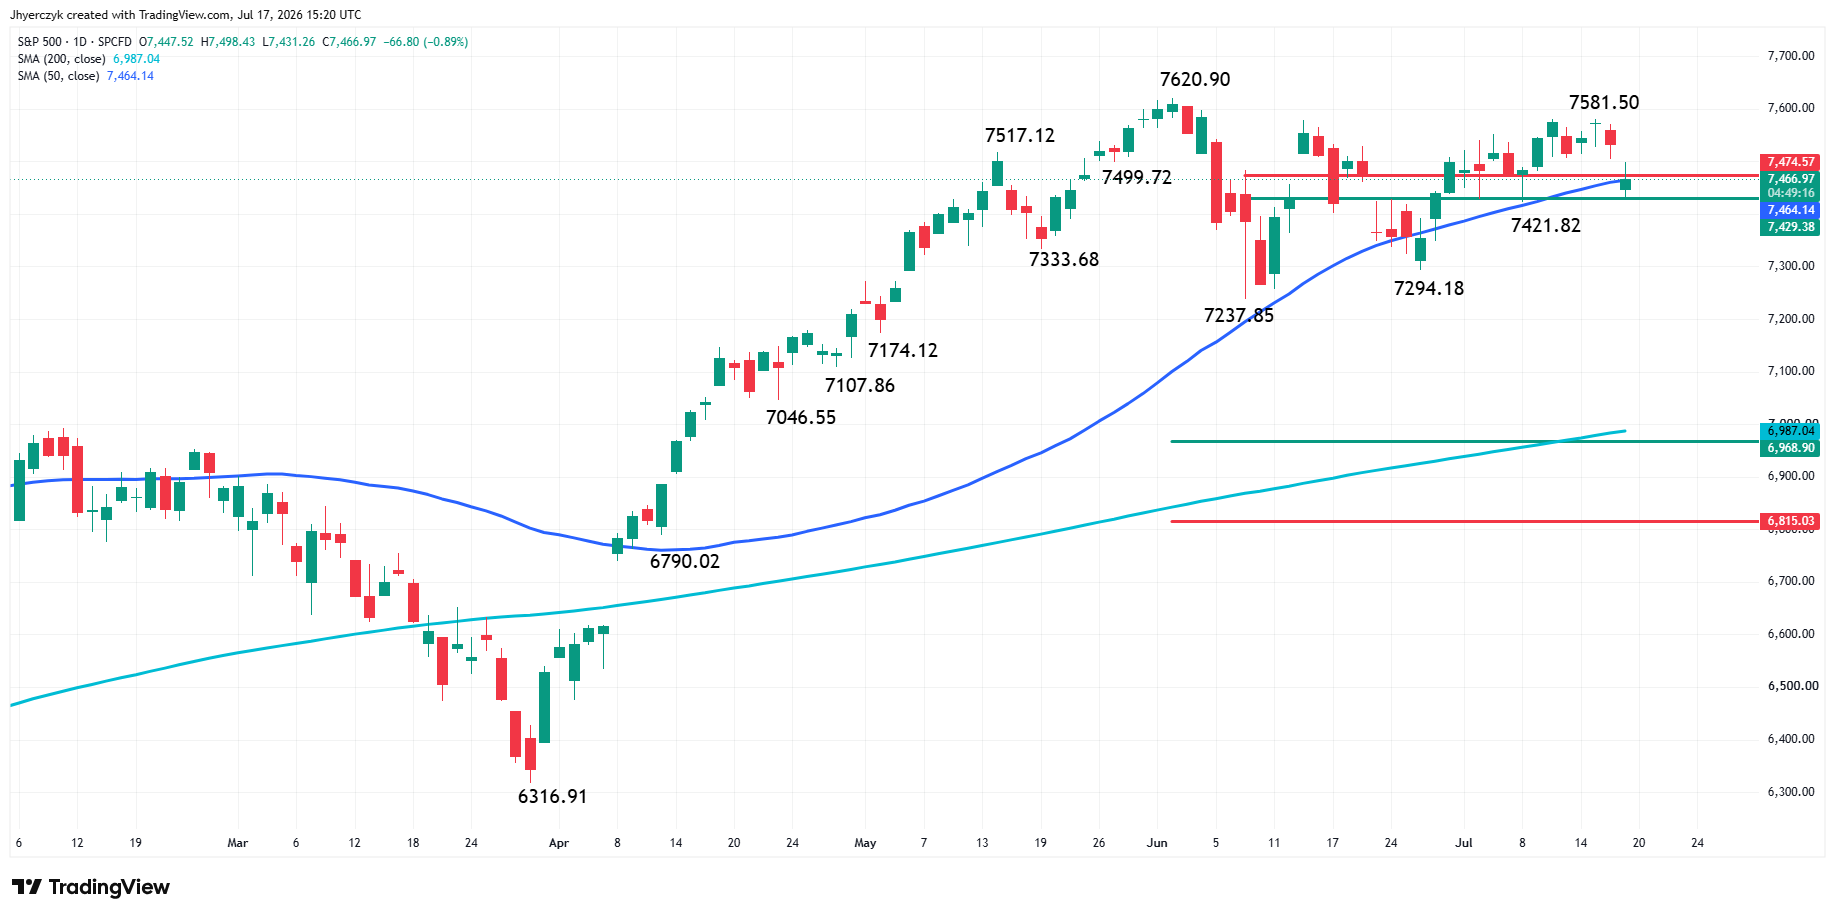
The S&P 500 Index is trading lower at the mid-session on Friday. Overnight weakness led to a gap lower opening in the cash market, triggering a break into the short-term retracement zone at 7474.57 to 7429.38 and the 50-day moving average at 7464.37.
While they are likely to work in tandem, I think the failure of the 50-day MA will have a greater impact on the market than the failure of the short-term pivot zone. I use them together because some traders are swing traders and some use moving averages. With the swings comes the retracement areas.
It is also important to note that we are looking for areas of interest that are likely to attract the most volume so we can get a better read on who is controlling the market. So essentially this is the battleground where the bulls and the bears determine the next major move in my opinion.
We’re also looking for the open spaces that will allow the index to run before the next battle area. Given the April to June range of 6316.91 to 7620.90, I think that a sustained move under the 50-day MA and the short-term 50% level at 7429.38 will open the door for an eventual test of the retracement zone at 6968.90 to 6815.00. Nearly clustered with this area is the 200-day moving average at 6987.05.
On the flipside, recovering the 50-day MA and crossing back to the bullish side of the short-term retracement zone, will ease the downside pressure and could shift the momentum enough to challenge the main tops at 7581.50 to 7620.90.
NASDAQ 100 Price Forecast
Every new NASDAQ 100 analysis as it publishes, today's technical signal and key levels, live price — on one page.
See all NASDAQ 100 forecastsDaily Nasdaq Composite Index Technical Analysis
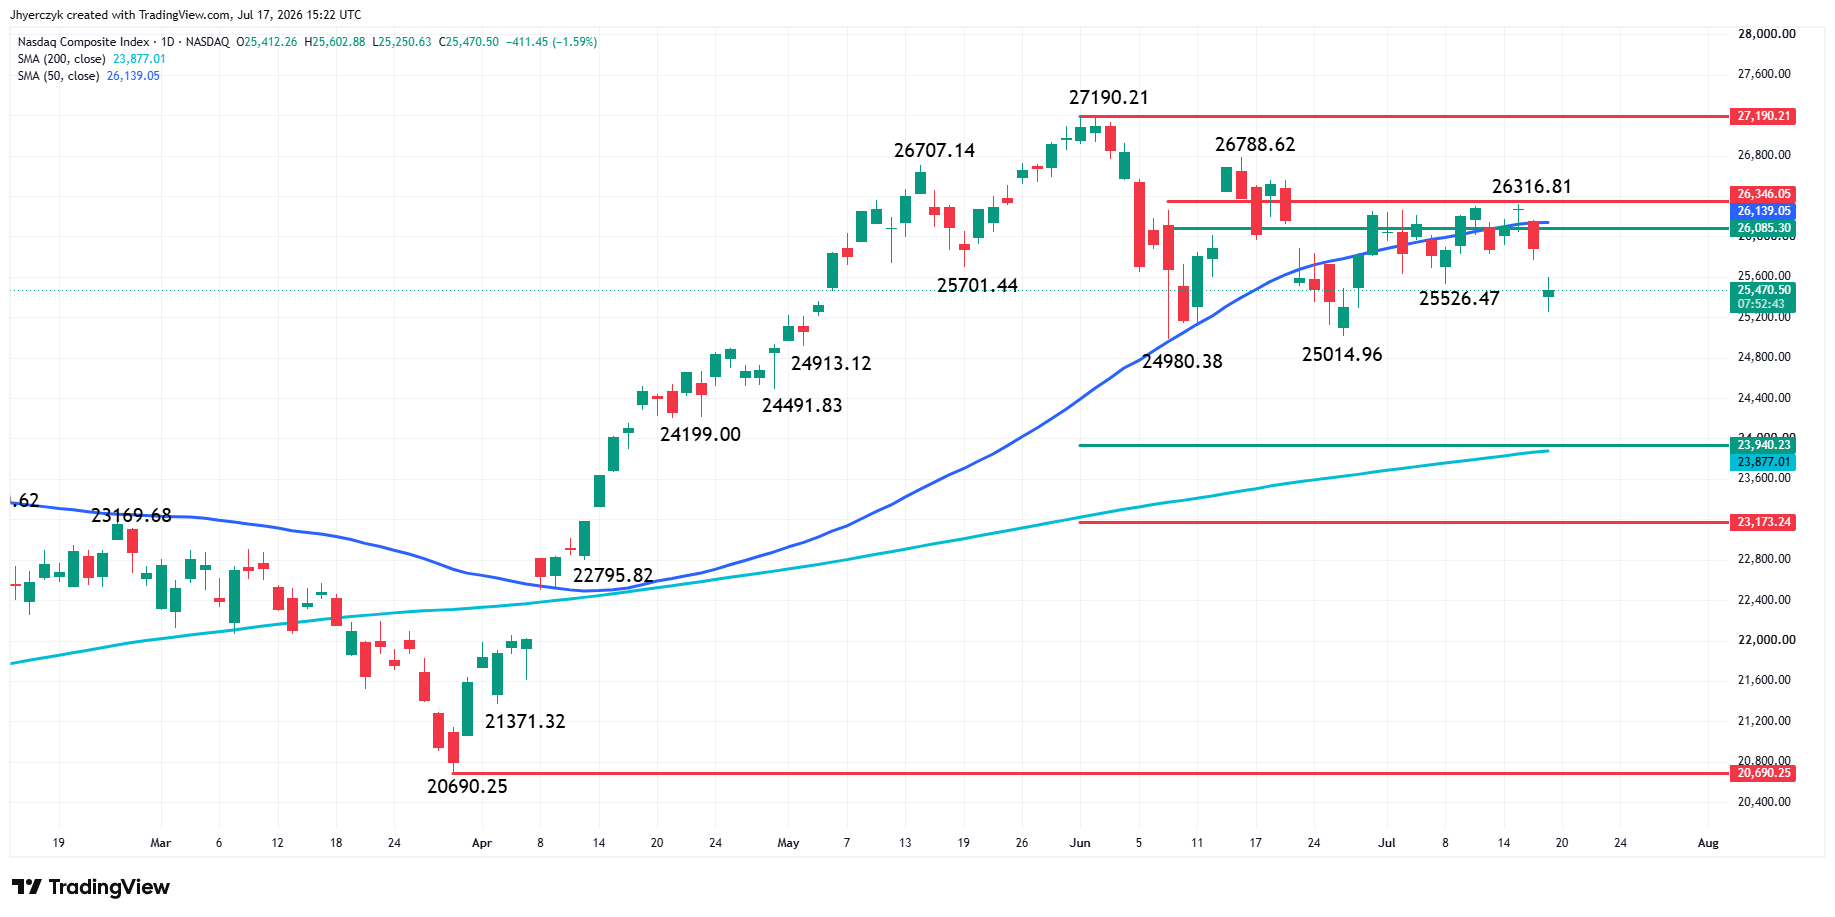
The Nasdaq Composite Index gapped lower on Friday and has successfully cleared the short-term retracement zone at 26085.30 to 26346.05. More importantly it is trading on the weak side of the 50-day MA at 26138.99.
If the normal rotation holds true, we expect to see a near-term rotation into the 200-day moving average at 23877.00.
Looking at the swing chart, we have a March 30 main bottom at 20690.25 and a June 1 main top at 27190.21. Its retracement zone target is 23940.23 to 23173.24. The 50% level at 23940.23 forms a tight support cluster with the 200-day MA at 23877.00, making it a valid downside target.
How it gets to this target area is the question because it does face potential headwinds at the pair of main bottoms at 25014.96 to 24980.38. If today’s price action is any indication, it’s going to be a long process if speculative buyers keep coming in on the dips.
Daily Dow Jones Industrial Average Technical Analysis
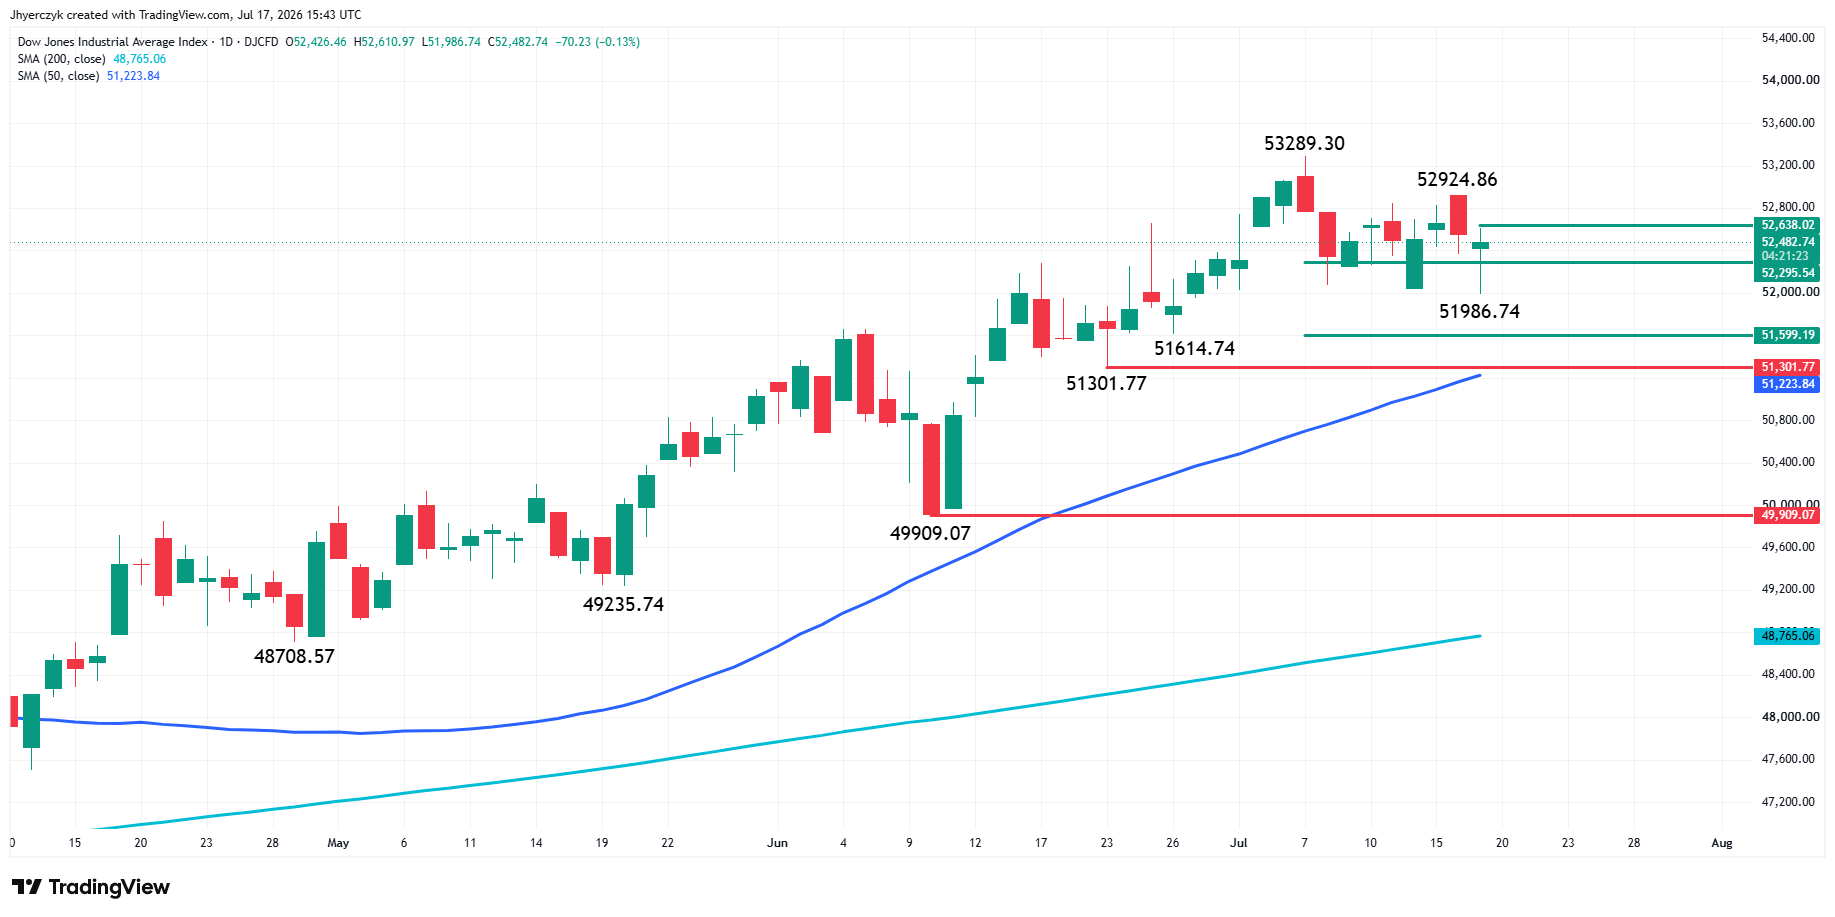
The Dow Jones Industrial Average is lower at the mid-session on Friday, but making a strong rebound from its intraday low at 51986.74.
The blue chip index has been choppy throughout July, but leaning to the downside with a secondary lower top at 52924.86 and move to its lowest level since June 29, earlier today.
With respect to the 50-day moving average at 51223.68, the Dow is still in a strong uptrend. It’s the swing chart that is causing some headwinds and the sideways to lower drift.
Key pivot levels to watch near the top are 52295.54 and 52638.02. The support pivot is 51599.19.
Thursday’s reversal down from 52924.86 and today’s lower-low has me leaning to the downside. But the Dow is trading differently than the S&P and Nasdaq, in that traders are not pressing lows. That’s probably because the overall bias is still to the upside because of the strength of the 50-day MA.
Daily VanEck Semiconductor ETF
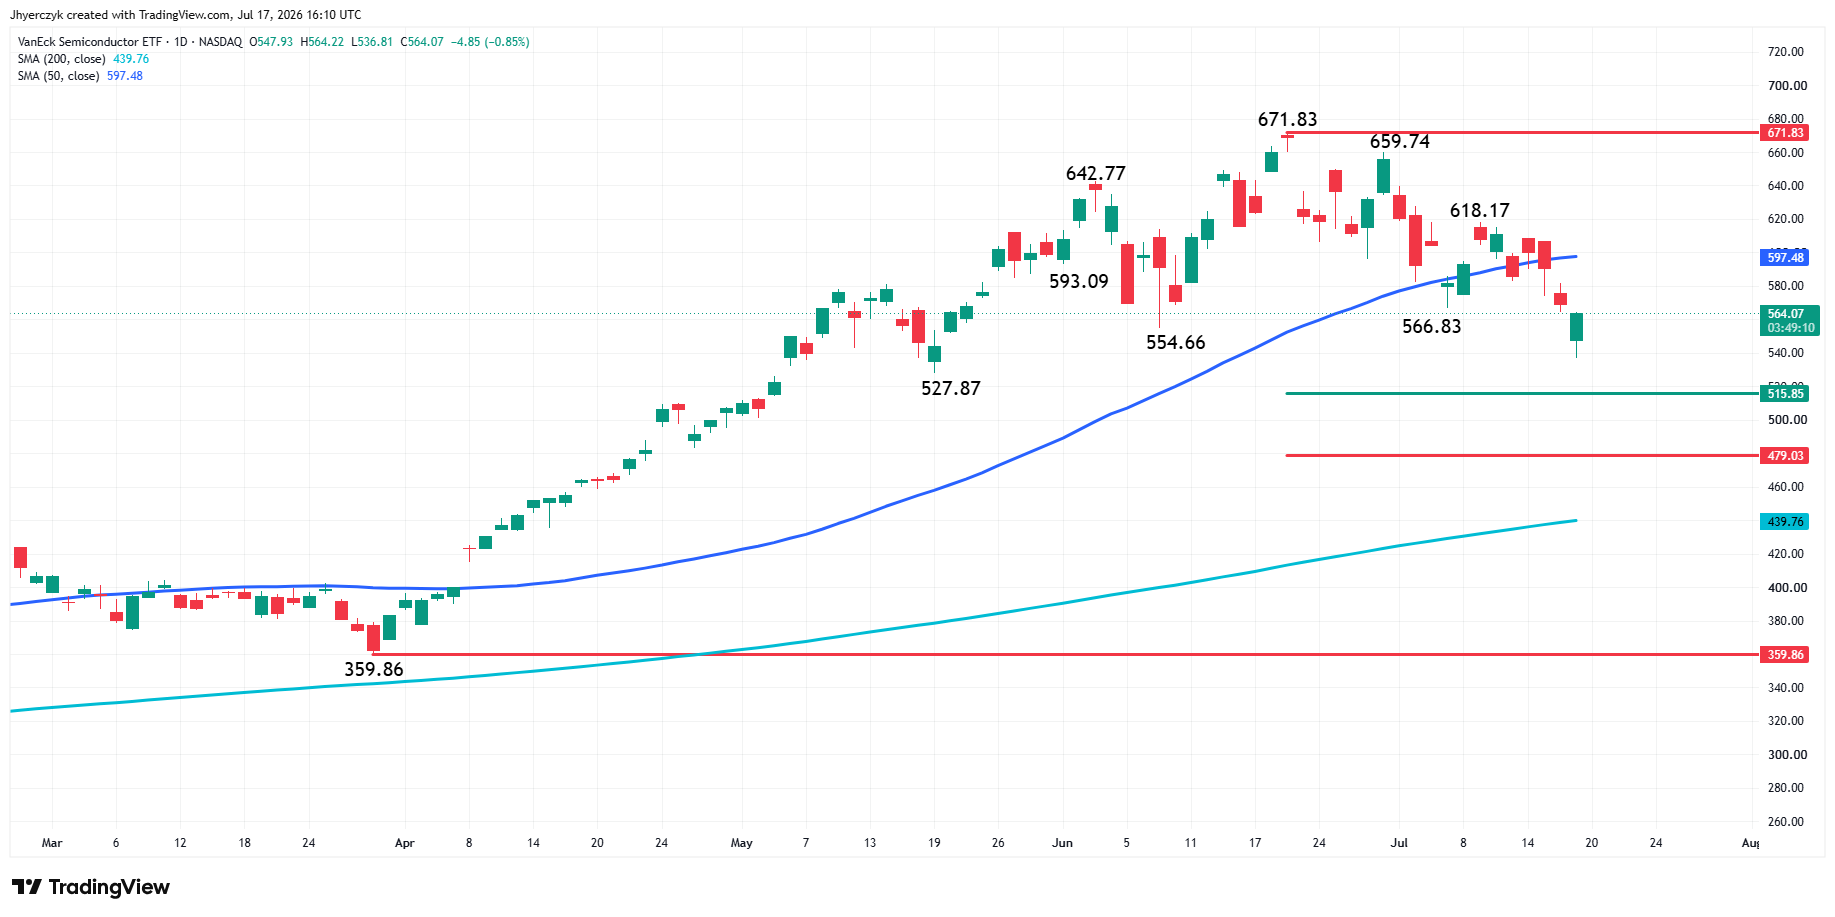
The VanEck Semiconductor ETF is in a downtrend according to the 50-day moving average at 597.47 and the daily swing chart. It’s been an orderly change in trend. The downtrend was reaffirmed early Friday when sellers took out the swing bottom at 566.83. The swing chart will change to up if the ETF recaptures 618.17.
The long-term range from the late March bottom at $359.86 to the mid-June top at $671.83 has created a retracement zone target at $515.85 to $479.03. This area may attract investors looking for value.
Stocks in the News
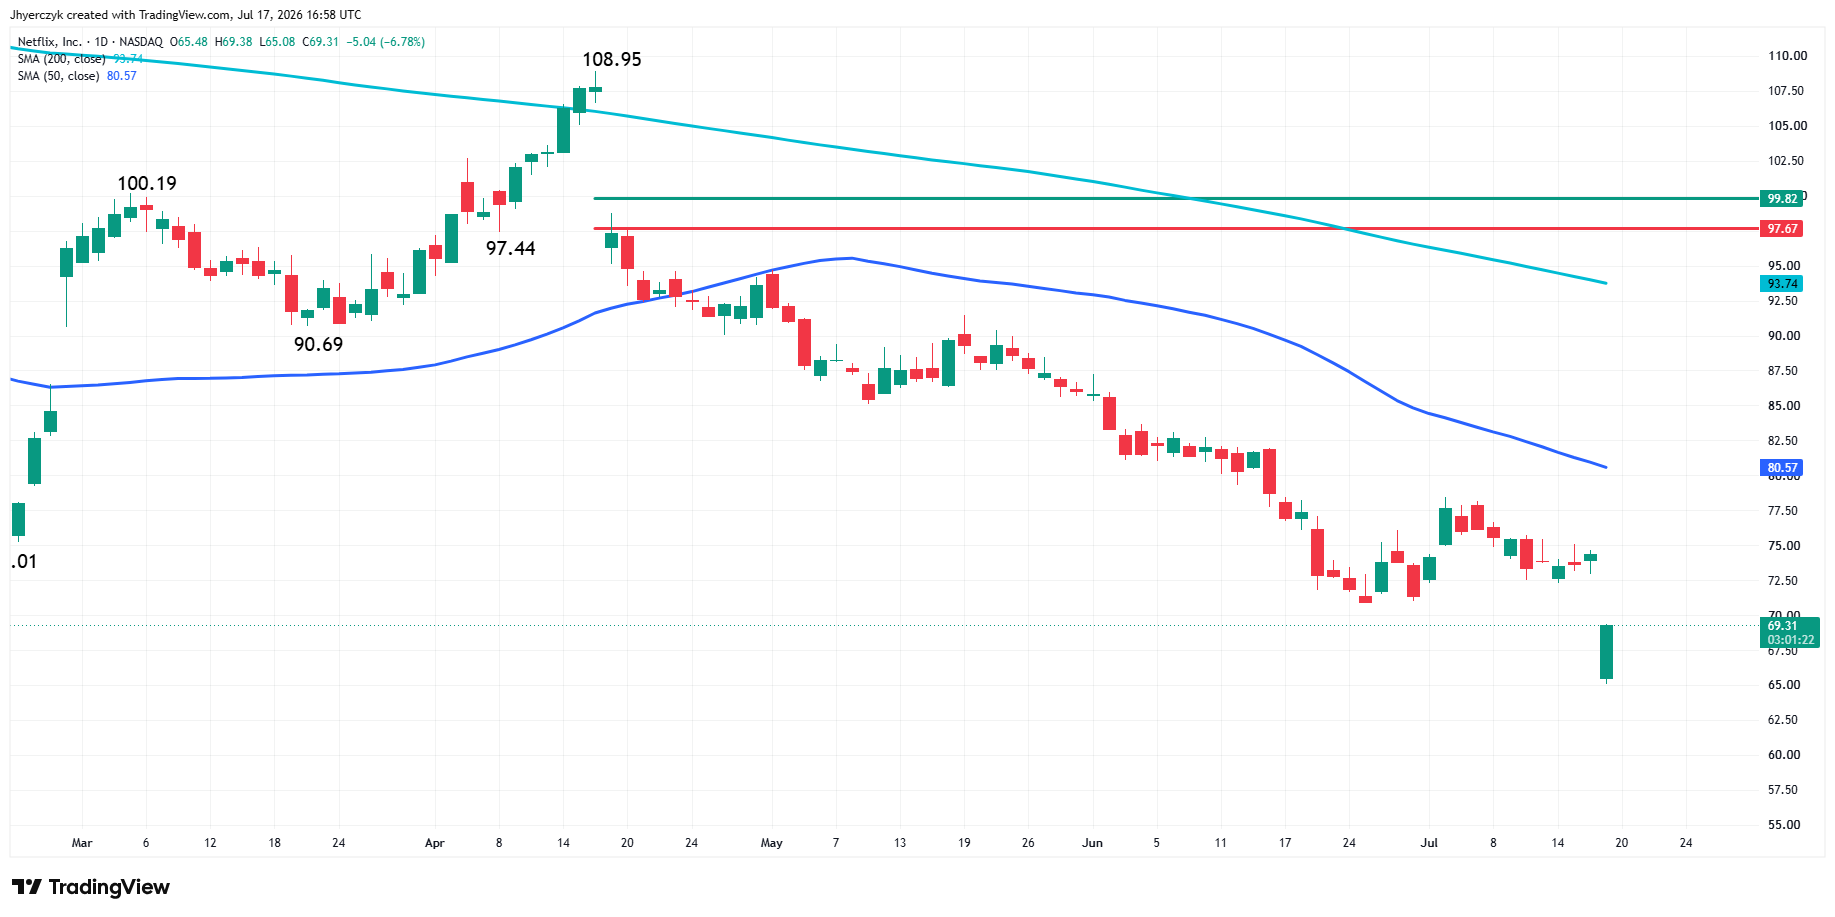
Netflix fell more than 8% after its forecast failed to ease concerns about slowing growth. China’s Moonshot AI announced a model it says competes with OpenAI and Anthropic, adding to the pressure on U.S. chip stocks already selling on valuation concerns.
What to Watch
The broader market has not broken but the AI trade is under heavy pressure from three directions at once. Chip valuations are being repriced, Chinese competition is challenging the spending thesis, and oil climbing on the Iran escalation is keeping rate pressure on growth stocks. The Dow is holding up because traders are not pressing lows with the 50-day moving average still supporting the uptrend. The S&P 500 and Nasdaq are a different story, both sitting at or below their 50-day moving averages with clear downside targets if the selling continues. Chips need to stabilize before either index can mount a recovery, and three days into this selloff the buyers have not shown up yet.
More Information in our Economic Calendar.