


Silver Bounced Off the 50-Day and CPI Lands in Hours
Silver buyers showed up Friday morning after Thursday’s selloff drove the market through a swing bottom and into the 50-day moving average. The main trend changed to down on the break through $63.31. Sellers could not extend it. A cluster of support from $62.98 down to $60.835 caught the metal before the damage got worse.
At 09:31 GMT, Spot Silver (XAGUSD) is trading at $64.20, up $0.62 or 0.97%. The session high is $64.35 and the low is $63.04.
Treasury yields are still near 5% on the 10-year. The dollar is firm. Crude is above $100. CPI at 12:30 GMT is the only number that can change any of those conditions before the Fed meets next week.
Daily Spot Silver (XAGUSD) Technical Analysis
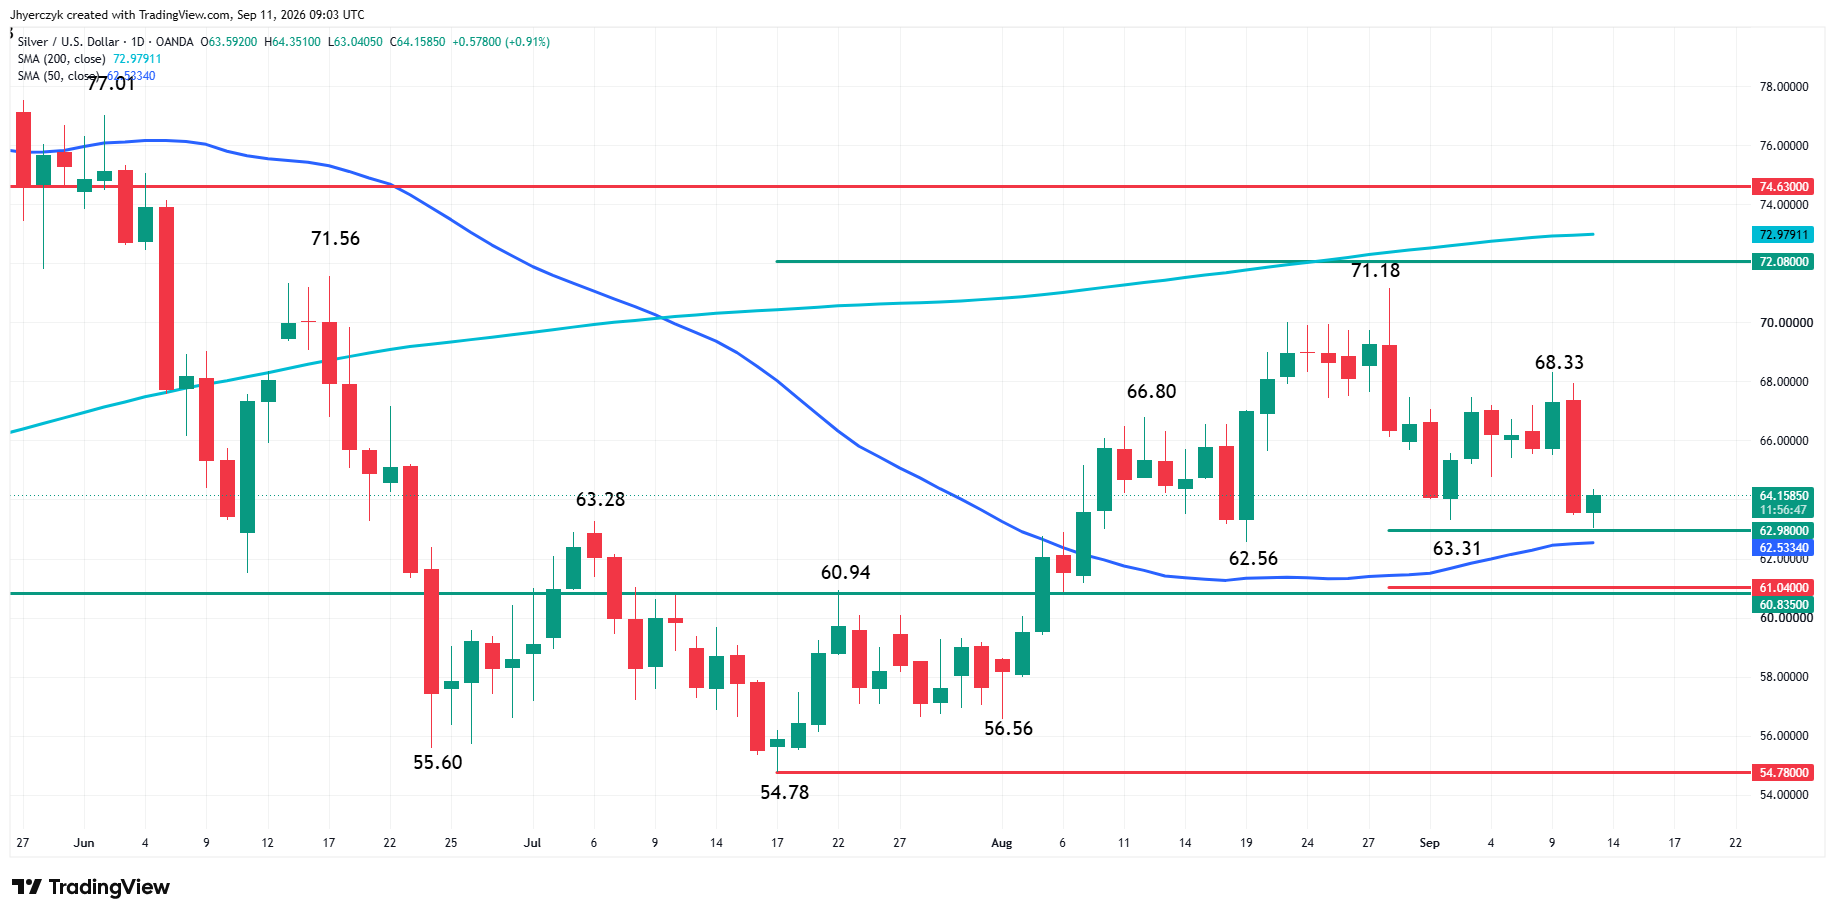
Spot silver is edging higher early Friday after recovering from an early session setback. The main trend is now down. It turned down earlier today when sellers took out the swing bottom at $63.31. A trade through $68.33 will change the trend to up.
The intermediate range is $54.78 to $71.18. Its 50% to 61.8% retracement zone is $62.98 to $61.04. Inside this zone are the August 19 main bottom at $62.56 and the 50-day moving average at $62.53.
Although the main trend turned down on the swing chart, the setup wasn’t there for a follow-through move lower because of the cluster of support. These support clusters tend to attract value-seekers. In other words, the sell-off into support may have attracted the buy-the-dip crowd, while the change in trend is likely to create a sell-the-rally situation. It all means we could be looking at heightened volatility and a two-sided trade.
Additional support is a cluster formed by the 61.8% level at $61.04 and 50% of the all-time high at $60.835.
A sustained move over the 50-day moving average at $62.53 will signal the presence of counter-trend buyers. This would set up the potential for a strong rebound. A sustained move under the 50-day moving average will be a sign of weakness and reaffirm the swing chart’s change in trend.
Silver Price Forecast
Every new Silver analysis as it publishes, today's technical signal and key levels, live price — on one page.
See all Silver forecastsThursday’s PPI Did Not Settle the Rate Debate
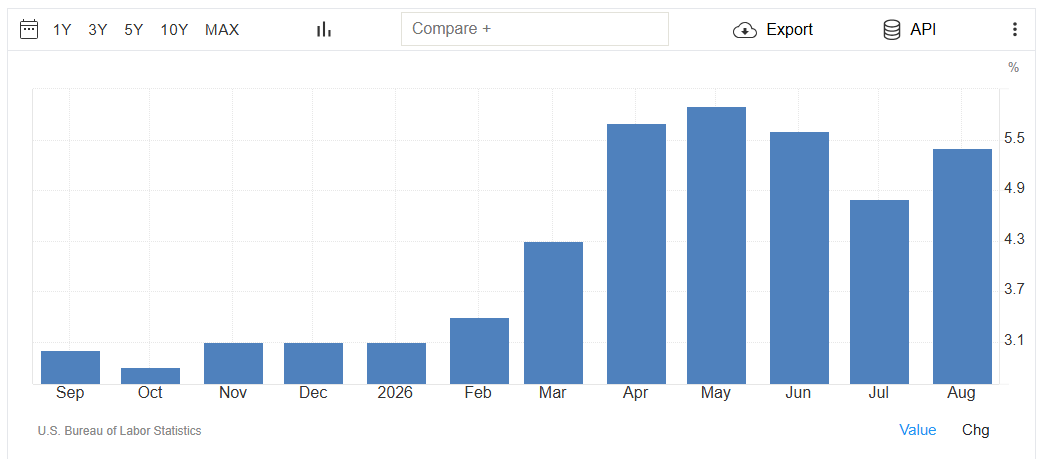
Thursday’s Producer Price Index increased 0.4% in August, matching expectations. The annual rate reached 5.4%. Core PPI excluding food and energy rose 0.2%, below the 0.3% forecast.
The core number was soft. It did not matter. Oil above $100 kept inflation concerns alive. Treasury yields pushed higher. The dollar strengthened. Markets raised the probability of a September 15-16 rate hike to around 70%. Silver broke through the swing bottom at $63.31 and the main trend flipped to down on the session.
Friday’s early recovery says the selling exhausted itself near the 50-day. It does not say the rate trade is over.
CPI at 12:30 GMT Is Running the Silver Trade
Economists expect headline CPI to rise 0.4% in August. The annual rate is expected near 3.4%. Core CPI is expected at 0.2% for the month and 2.4% from a year earlier.
Core is the number that matters for silver. The August report covers the period before the latest crude surge above $100, so the energy pass-through from this week’s tanker attacks is not in the data yet. The Fed still has to consider what $100 crude does to the inflation path over the next several months. That is sitting behind whatever the CPI prints Friday morning.
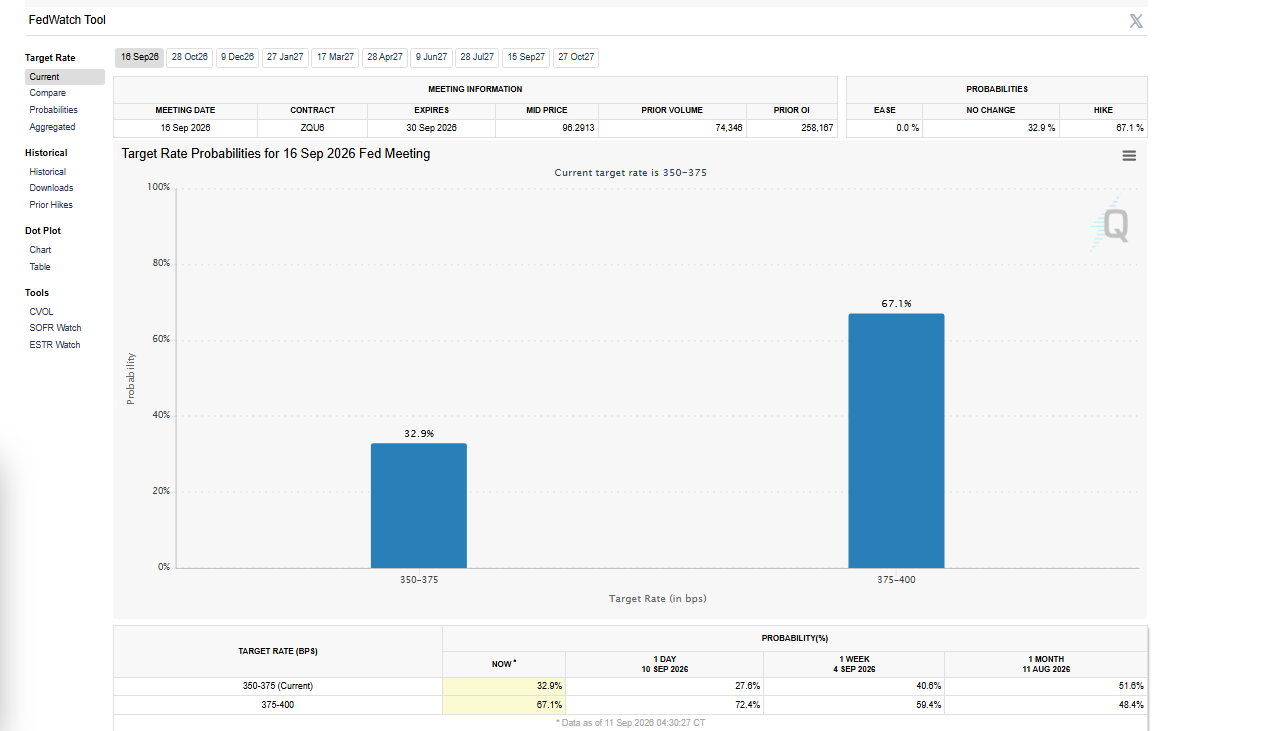
Rate-hike odds are at 70% for next week. The 10-year is near 5%. The dollar is firm after Thursday’s advance. Those are the conditions silver is trading into the number.
$100 Oil Is Not Going Away Before the Fed Meeting
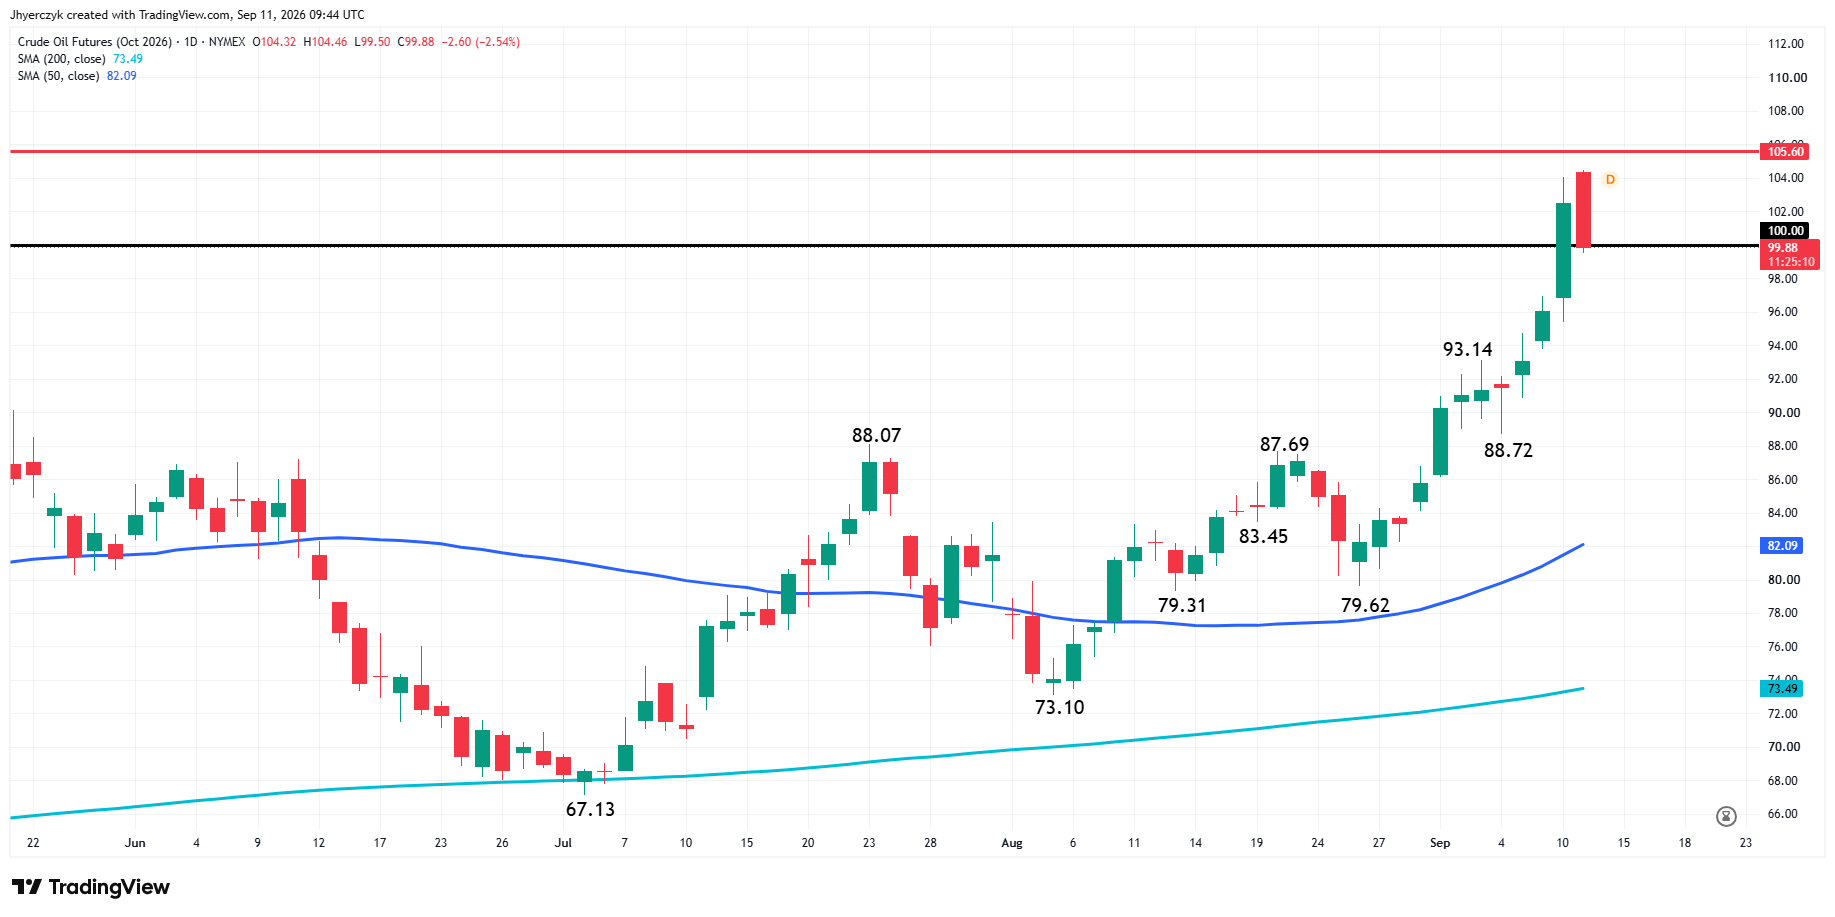
WTI broke through $100 this week. Brent moved above $107. Middle East supply disruptions hit 6.7 million barrels per day of shut-ins in August. Houthis seized a Yemeni port on Thursday. Tanker attacks continued across the Strait of Hormuz.
The oil story is not a one-day headline for silver. Crude above $100 keeps inflation pressure alive regardless of what the August CPI shows. A soft core number gives silver a bid Friday. The $100 barrel is still sitting on the market when the Fed meets September 15-16.
What to Watch
CPI at 12:30 GMT decides Friday’s session. Core at 0.2% or lower takes pressure off yields and the dollar and gives silver room to extend the rebound. Core at 0.3% keeps the 70% September hike odds where they are and puts the metal back under pressure. The number lands with the 10-year near 5%, crude above $100 and the Fed six days away.
The bias leans bearish with the main trend down on the swing chart after Thursday’s break through $63.31. However, the support cluster from $62.98 to $60.835 with the 50-day at $62.53 and the August main bottom at $62.56 inside it makes pressing shorts risky at this level. The 50-day moving average is the guide. A sustained move above $62.53 signals counter-trend buyers are in control. A failure there reaffirms the trend change and opens $61.04 and $60.835 below. Friday morning’s bounce is encouraging. CPI decides whether it holds.
More Information in our Economic Calendar.