


Gold & Silver Outlook: Fed Hike Bets Surge as Middle East Conflict Keeps Safe-Haven Demand Alive
Gold and silver are under pressure on Friday from opposing fundamental forces with Fed rate hike expectations climbing with U.S. inflation and defensive asset demand increasing with the ongoing conflict in the Middle East.
U.S. Producer Price Index data released Thursday was the first of several reports this week that will drive monetary policy for the remainder of the year. Producer prices for August were up 0.4% and annual inflation was 5.4%. Price increases were seen in energy, transportation and a host of other sectors from disruptions to global oil supply from the Iran conflict. As a result, market expectations for the Fed moving to hike rates by 25 basis points jumped from 65% to 70%.
The focus is quickly shifting to Friday’s U.S. Consumer Price Index data to be released at 12:30 GMT. Market analysts have set forecasts for a 0.4% increase in headline inflation from August and a 3.4% annual increase. It is expected that inflation will be 0.2% for the core, and 2.4% for the year. Bigger core inflation will justify a Fed policy of tightening, making the opportunity cost higher on holding precious metals that yield nothing.
Of the two, geopolitics is a stronger driver. The Iran-Allied Houthis have begun their push up the Red Sea from Mocha’s port, with the Houthi’s keeping the area around the Strait of Hormuz under attack. This threatens global energy supply and increases the ‘gold puzzle’. Longer conflict will draw interest to gold as a safe haven while inflation expectations will strengthen even more and push for tighter monetary policy.
Silver’s physical market offers more support than average. This is in contrast to Silver’s average exposure to the yield-curve inversion. All throughout 2026, the global silver market will most likely have a structural deficit, causing physical market demand to outpace supply. This, combined with the fact that industries are looking to lower their consumption of silver to zero, will cause a deficit in physical supply.
Fundamental bias: Until CPI comes out, gold is expected to be neutral to bearish, silver is expected to be neutral. Silver’s price action following the release of the CPI report will determine the near-term bias of both silver and gold.
Gold Technical Analysis: XAU/USD Tests $4,288 Support as Descending Trend Keeps Pressure Intact
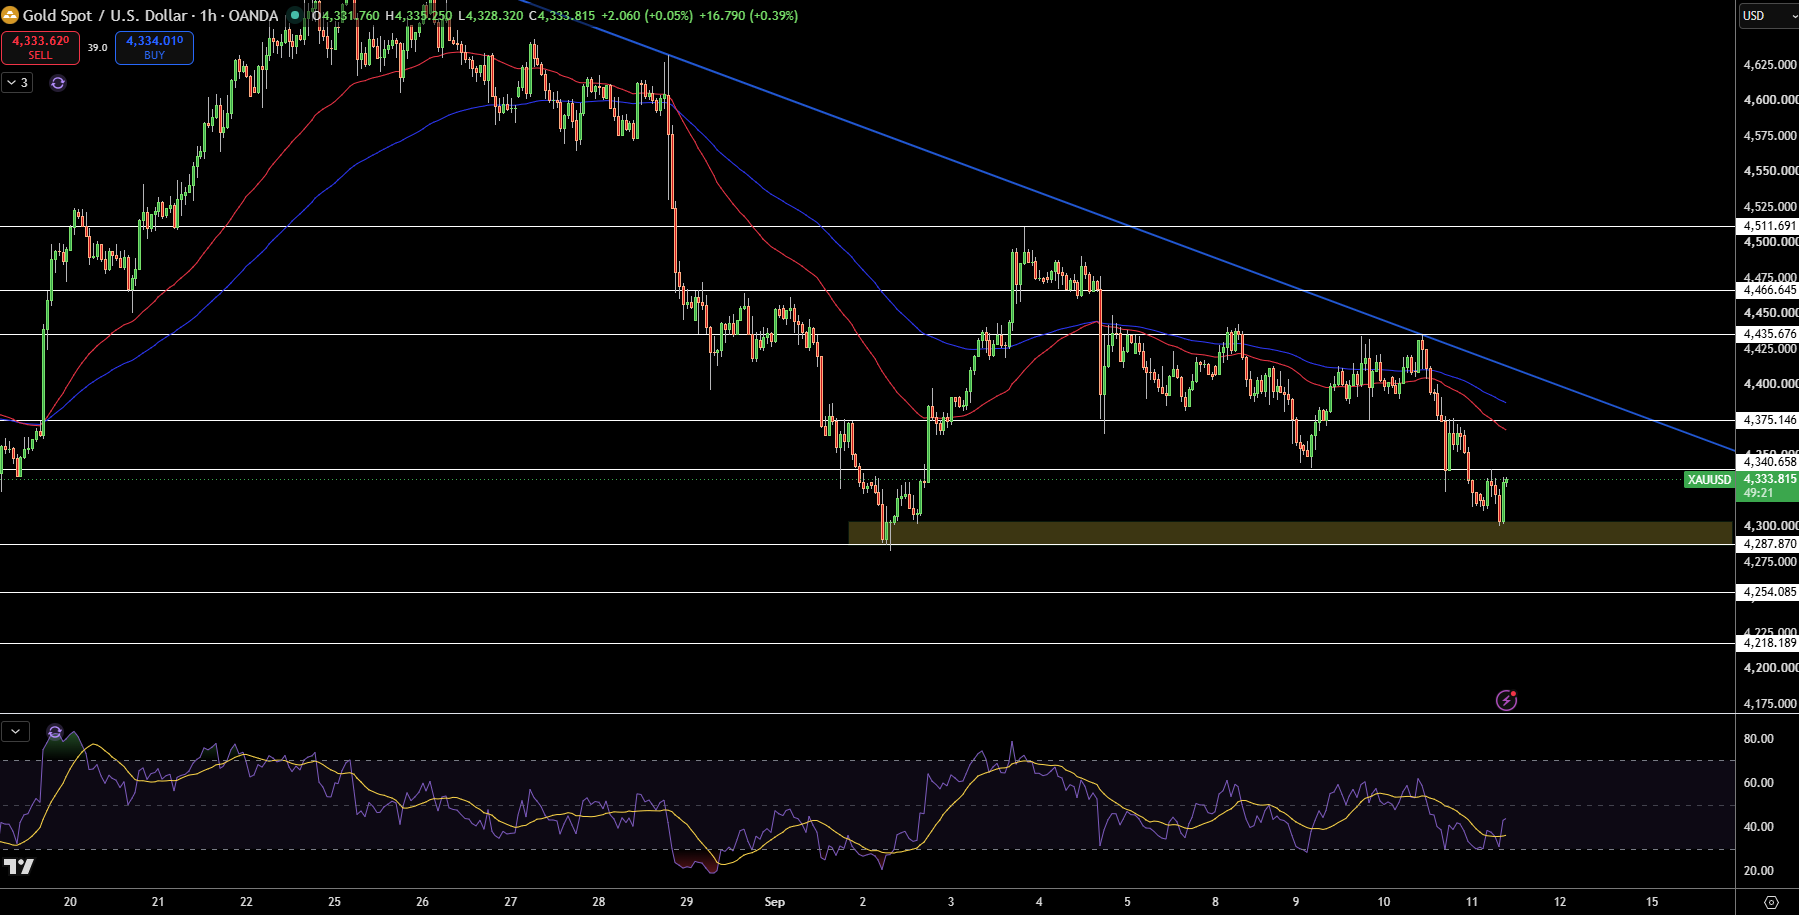
Gold currently stands at $4,334 on the 1-hour chart, another rejection at the descending trend line. I’m particularly interested that price currently stands below both moving averages, and has failed numerous attempts to breach $4,375 – $4,435 and test the resistance level. The latest price action to $4,288 shows buyers having support at the bottom of the range, but the overall structure still leans toward a bear trend.
I have $4,288 as my first support level. If price does break this level, I see$4,254 and $4,218 as subsequent levels to watch. The first resistance in this level would be $4,341. Beyond $4,341, we would begin to see important levels at $4,375 and $4,435.
RSI is currently in oversold territory and has recovered, but is still below the mid line, and overall market momentum is still looking weak. From this analysis, I believe the overall trend is still bearish until $4,375 – $4,435 resistance levels are breached. If price closes above $4,435, the trend would be considered more neutral. As is, a break at $4,288 supports an extension of the downward trend.
Gold Price Forecast
Every new Gold analysis as it publishes, today's technical signal and key levels, live price — on one page.
See all Gold forecastsSilver Technical Analysis: XAG/USD Breaks Rising Support as $62.55 Comes Into Focus
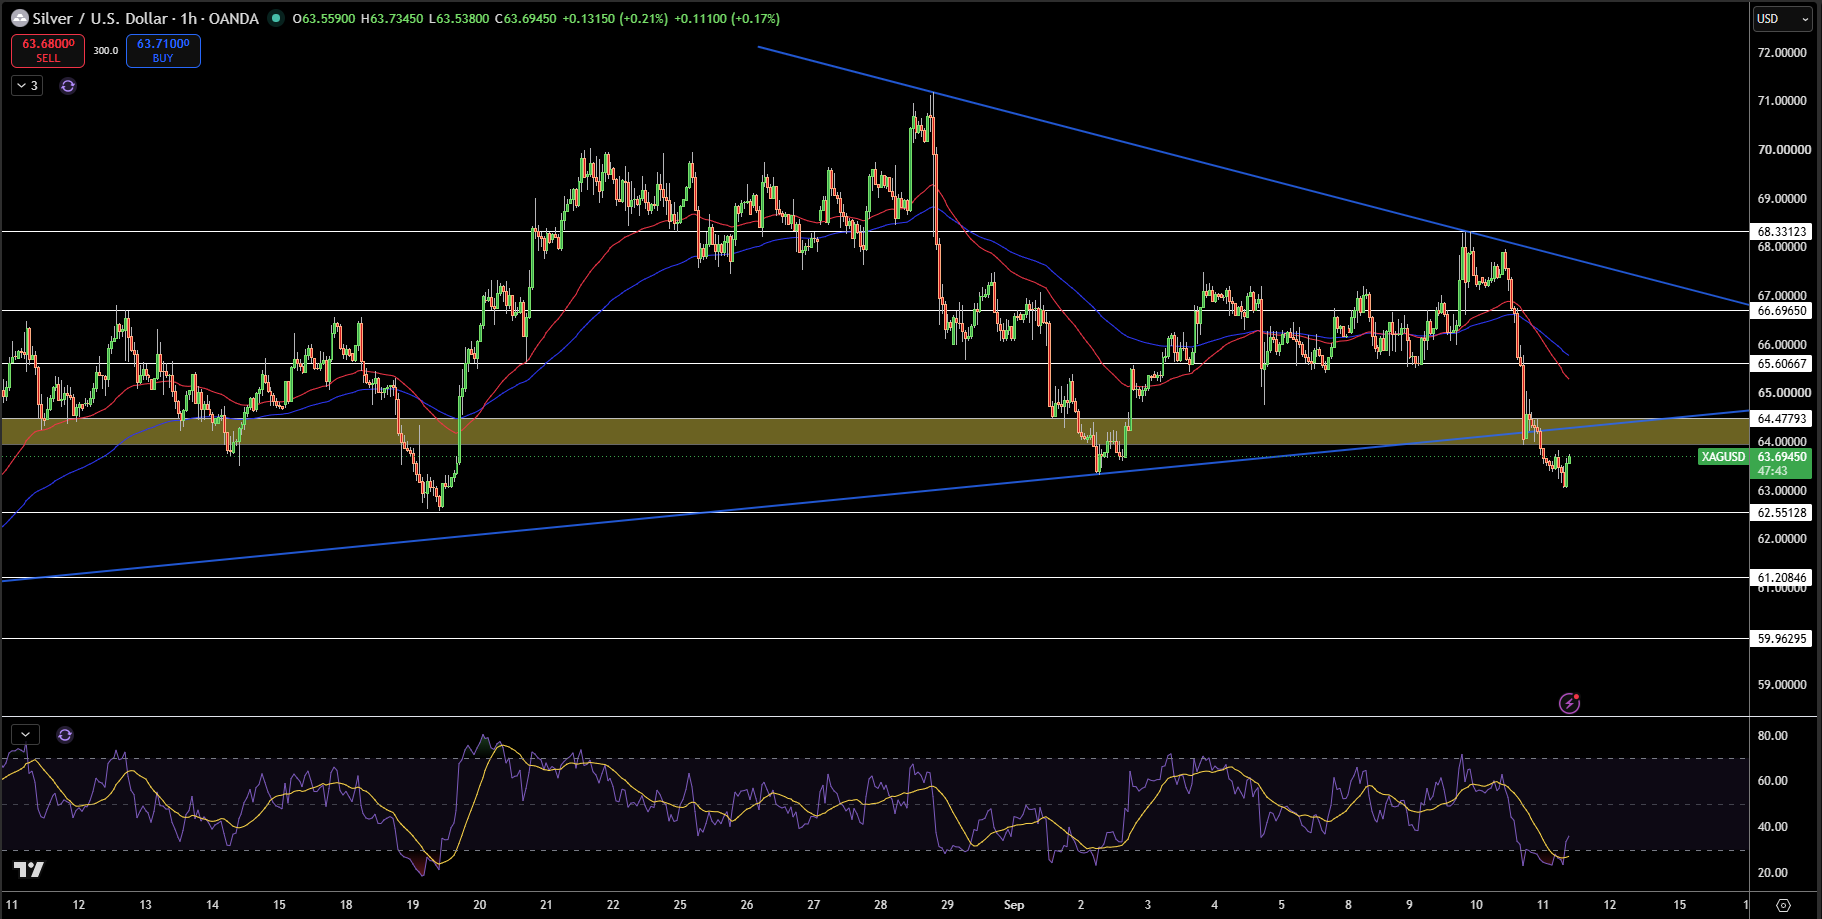
Silver currently stands at $63.69 on the 1-hour chart after a break below the rising trend line and a reception at $64.48. Although we have had a small move to the upside, the overall short term structure is still looking Bearish.
I have $62.55 as my next level of support. I see $61.37 and $60.87 as other levels to watch. $63.32 is the next resistance level. Beyond this I see $63.75 which is important, along with $64.48.
RSI is heavily in oversold territory. Overall, looking at the chart, I see that the short term structure is heavily leaning bullish. I believe this would continue until $63.32 and $63.75 are breached.
The first support I am monitoring is $62.55. A clear break beneath this would present $61.21 and $59.96 as supports next. There is resistance at $64.48 for now, with $65.61 and $66.70 coming into play should buyers return.
RSI is coming off oversold but is still showing bearish signs, so I am leaning more towards the bearish side while silver is trading beneath $64.48 – $65.61. A break beneath $62.55 confirms further down moves, and a break above $65.61 confirms the bullish side. While it is sideways trading, $64.48 – $65.61 is the likely price range.