


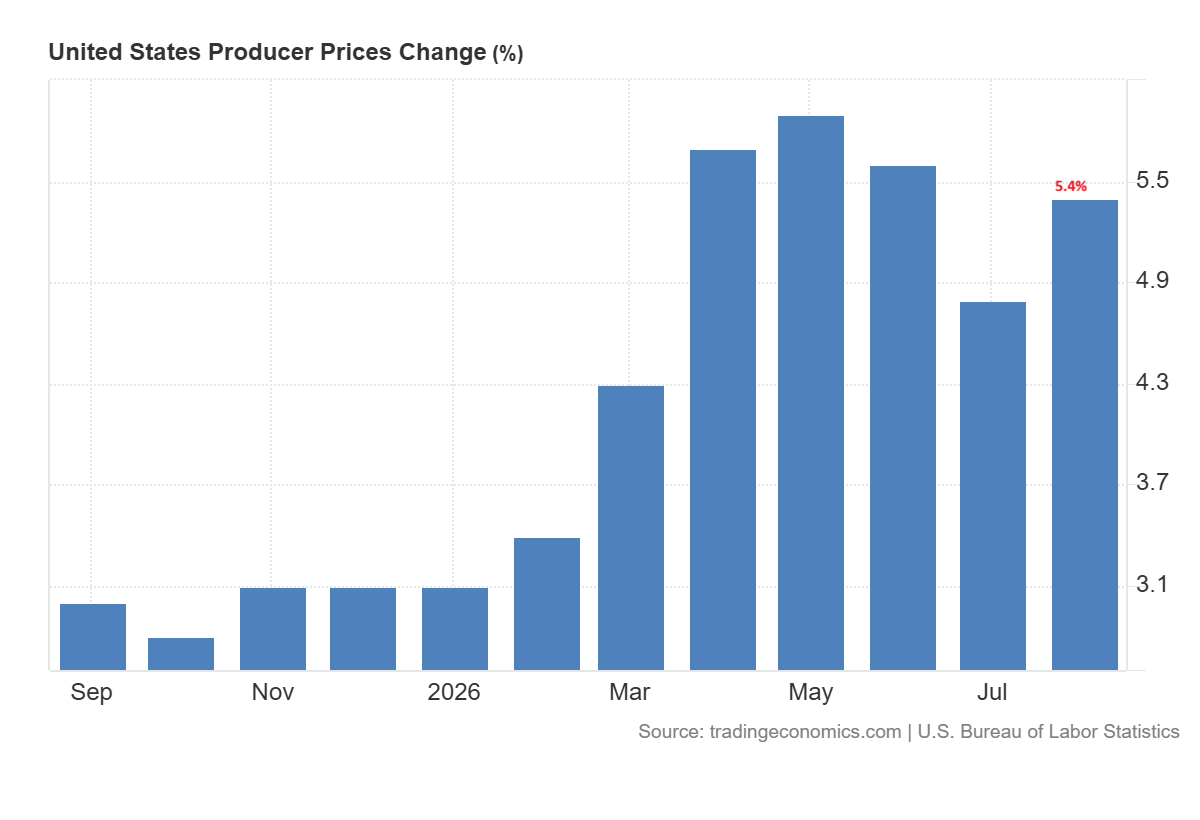
Gold (XAU) prices dropped toward $4,320 as strong U.S. PPI data and higher oil prices raised the odds of rate hike by the Federal Reserve. These pressures also affected the silver (XAG) price outlook ahead of the upcoming US CPI report on Friday. The annual producer inflation rate increased to 5.4% in August from 4.8% in July. There was evidence of price pressures beyond food and energy as core PPI rose to 4.6% from 4.3%.
Gold and Silver Outlook: US CPI and Fed Rate Risks
The BLS data suggest that inflation remains too high. According to the FedWatch tool, the expectations of a rate hike in September increased to 72% after the release of US PPI data.
The escalation of the conflict between the US and Iran further raises the risk of inflation. The new attacks on shipping vessels off the coast of the Strait of Hormuz are stoking concerns about continued disruption in oil supplies. These attacks represent a major escalation. Higher oil prices increase transport and production costs and hence can help to sustain inflation. While geopolitical risk can attract buyers to gold, the prospect of higher interest rates works against that support.
The market is now waiting for the US CPI data to be released on Friday. The strong inflation data may support the case for a Fed rate hike. That could drive up Treasury yields and the U.S. dollar, which would further weigh on both commodities. But if inflation comes in less robust, buyers may return. Another risk factor for silver is its industrial applications. The higher interest rates and high energy prices may slow manufacturing and reduce the demand for silver.
Gold Price Forecast: $4,270 Support Faces a Key Test
Gold Approaches Key Support Near $4,270
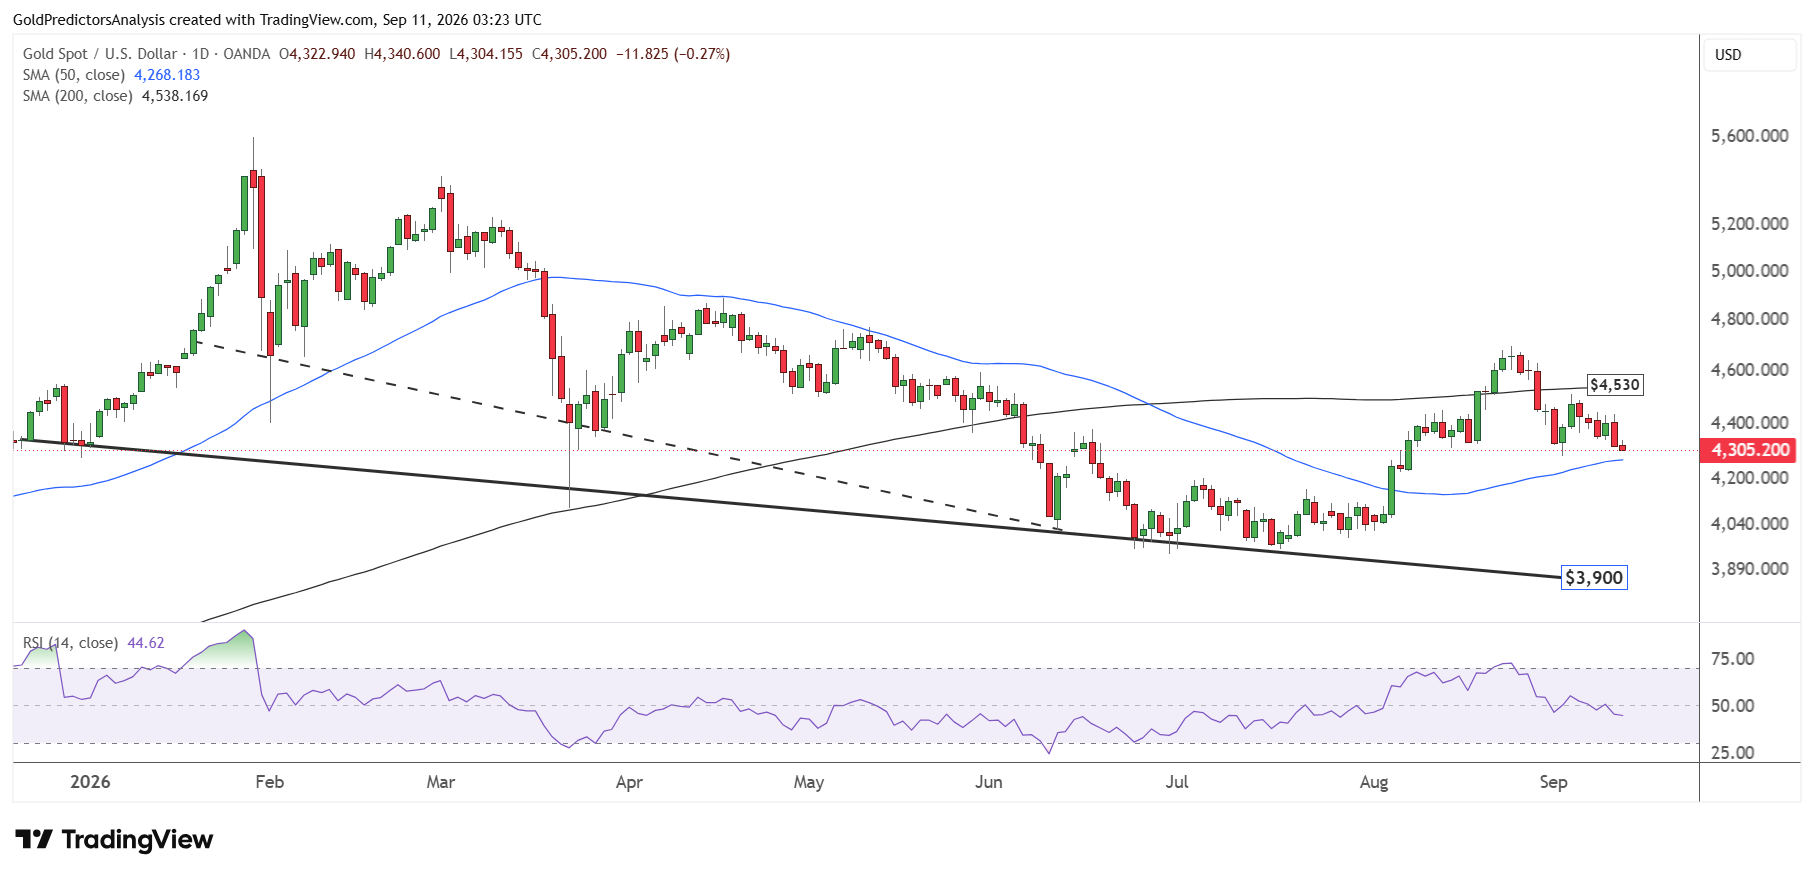
The daily chart for spot gold shows a negative price action in the short term. The price dropped after the US PPI data and fell 1.90% on Thursday. The strong negative candle for Thursday indicates weakness in gold in the short term. The 50-day SMA near $4,270 remains the immediate support for spot gold. A break below this level will likely open the way for the $4,000 area.
Gold Price Forecast
Every new Gold analysis as it publishes, today's technical signal and key levels, live price — on one page.
See all Gold forecastsThe market is now waiting for the US CPI data. If the price drops into the $4,250 area and then recovers to close above $4,350, it will likely form the bottom and push price back toward $4,530. But the RSI remains below the midline, which indicates negative price action in the short term.
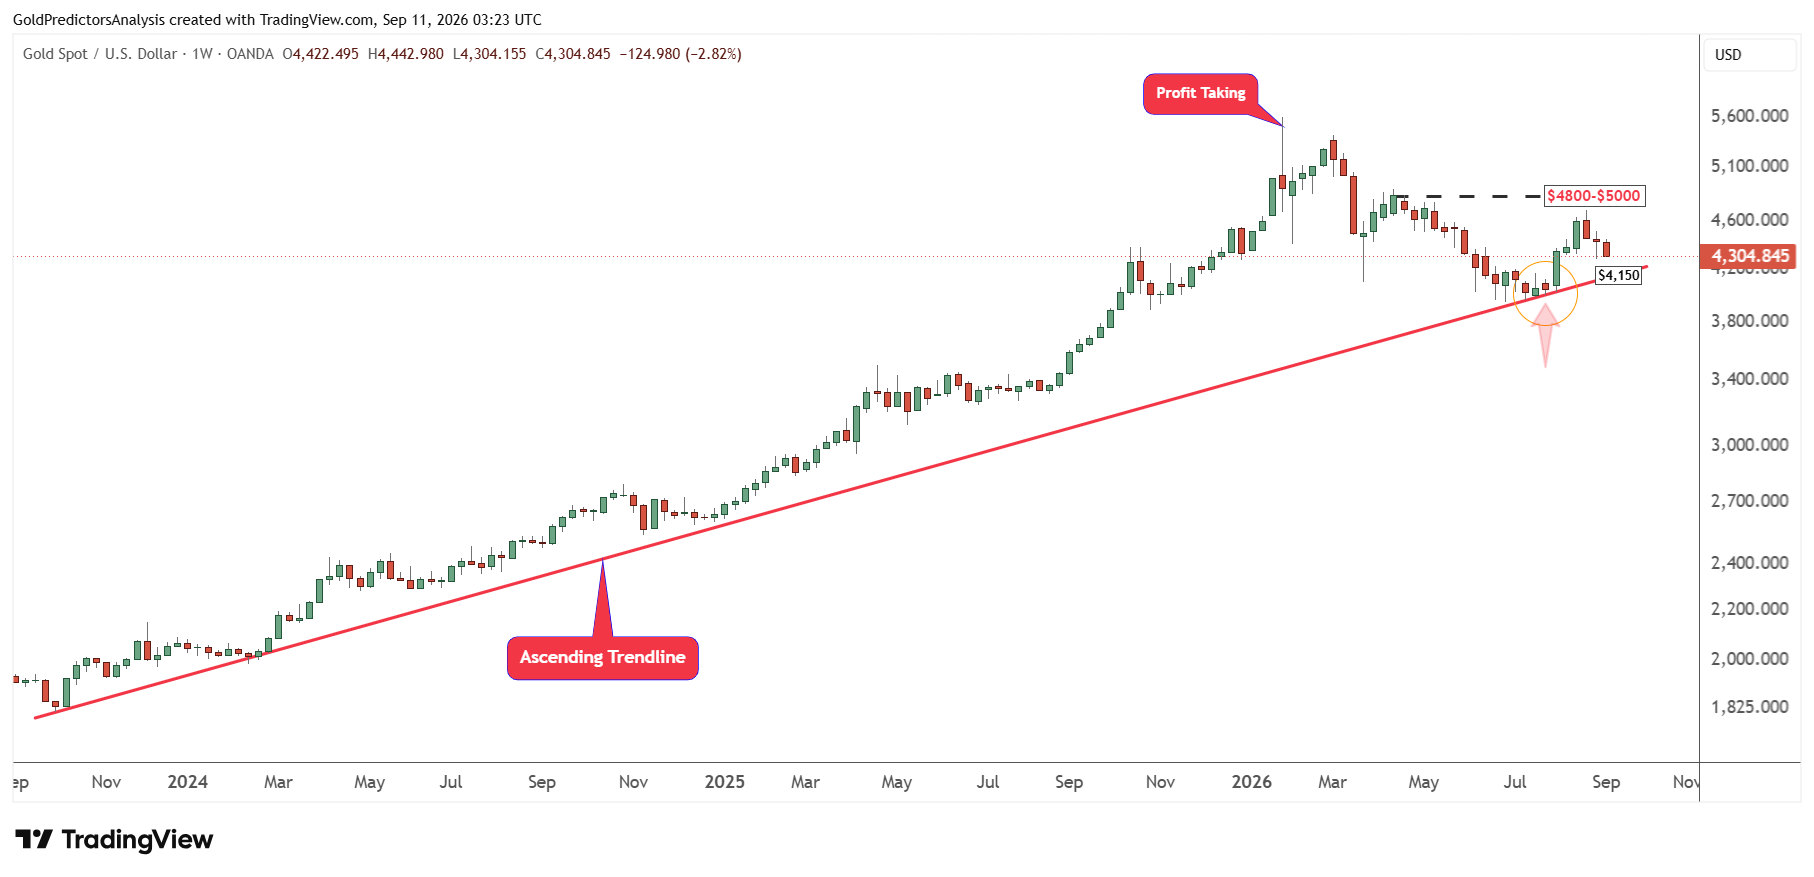
The weekly chart for spot gold also shows negative price action as the price drops from the strong resistance zone of $4,800. The price now looks to drop back toward the $4,150 zone, which is strong support along the rising trendline that stretches from the October 2023 lows.
A break below $4,150 will likely push the spot gold price towards the $4,000 area. On the other hand, a confirmed break above $4,500 will likely open the way for a strong rally towards the $4,800 to $5,000 area.
A Break Below $4,300 Could Extend Gold’s Decline
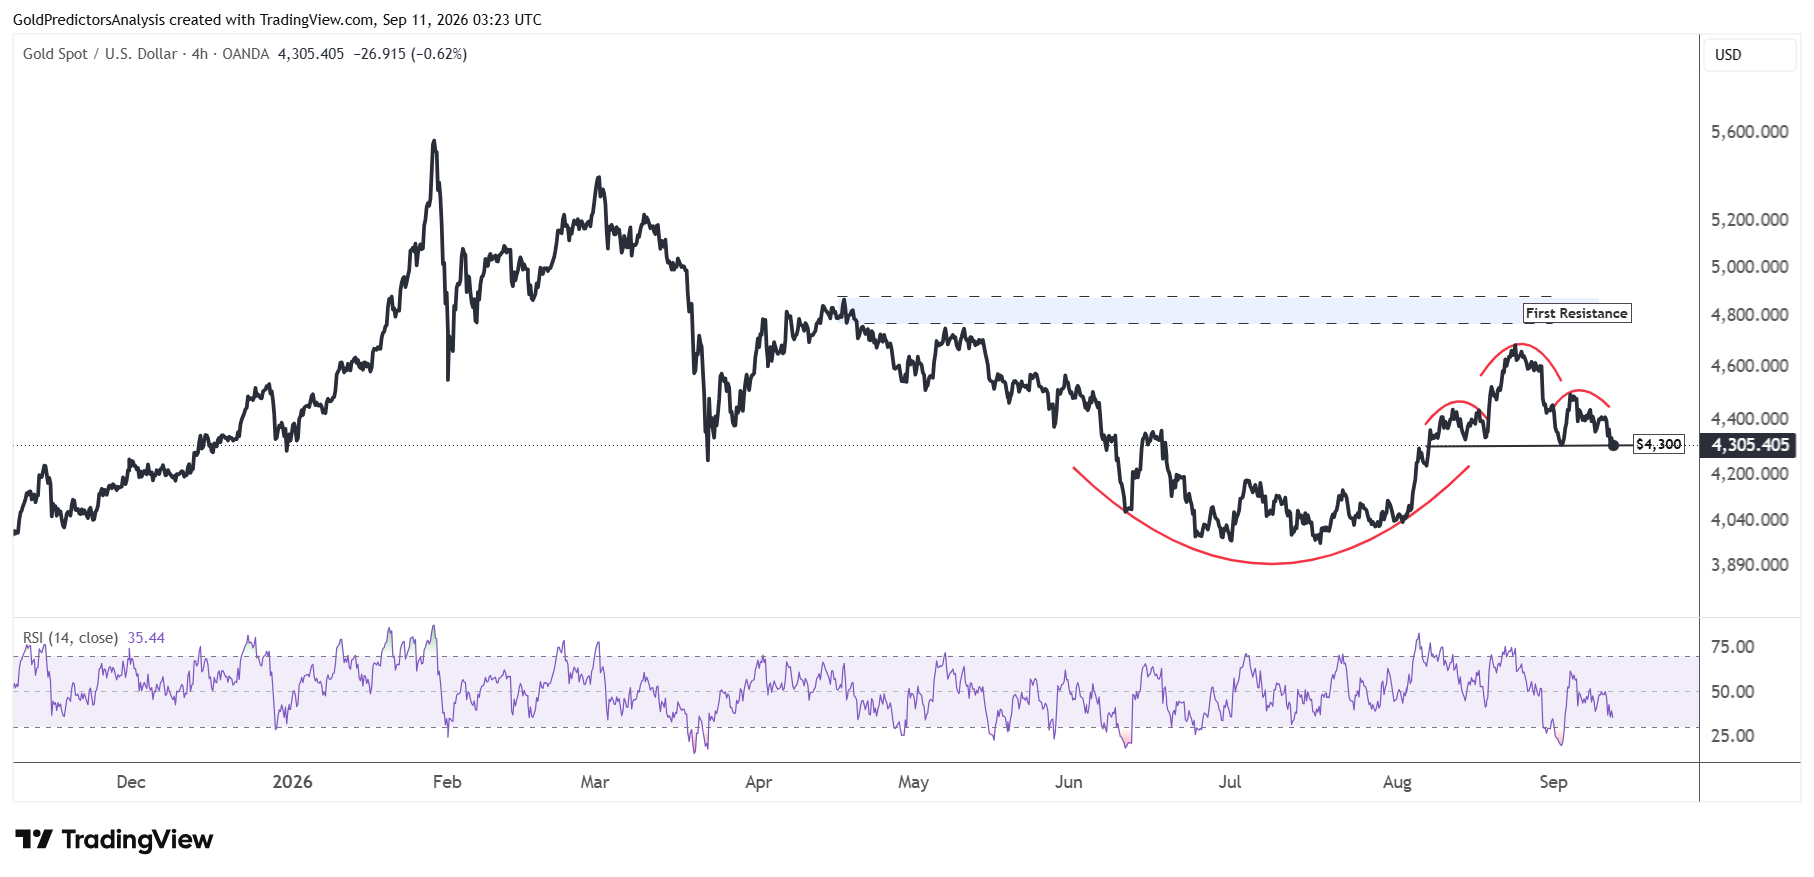
The 4-hour chart for spot gold shows that the price currently sits at the decision level ahead of CPI data. A break below $4,300 will likely confirm the head and shoulders pattern and trigger drop toward $4,150. But if price fails to break below $4,300 and recovers above $4,530, it will likely confirm strong rally back towards the $4,800 level. Therefore, the direction for spot gold remains uncertain in the short term as the market waits for the next economic data.
Silver Price Forecast: $62 Support at Risk After Sell-Off
Silver Holds Above $62 After Thursday’s Sell-Off
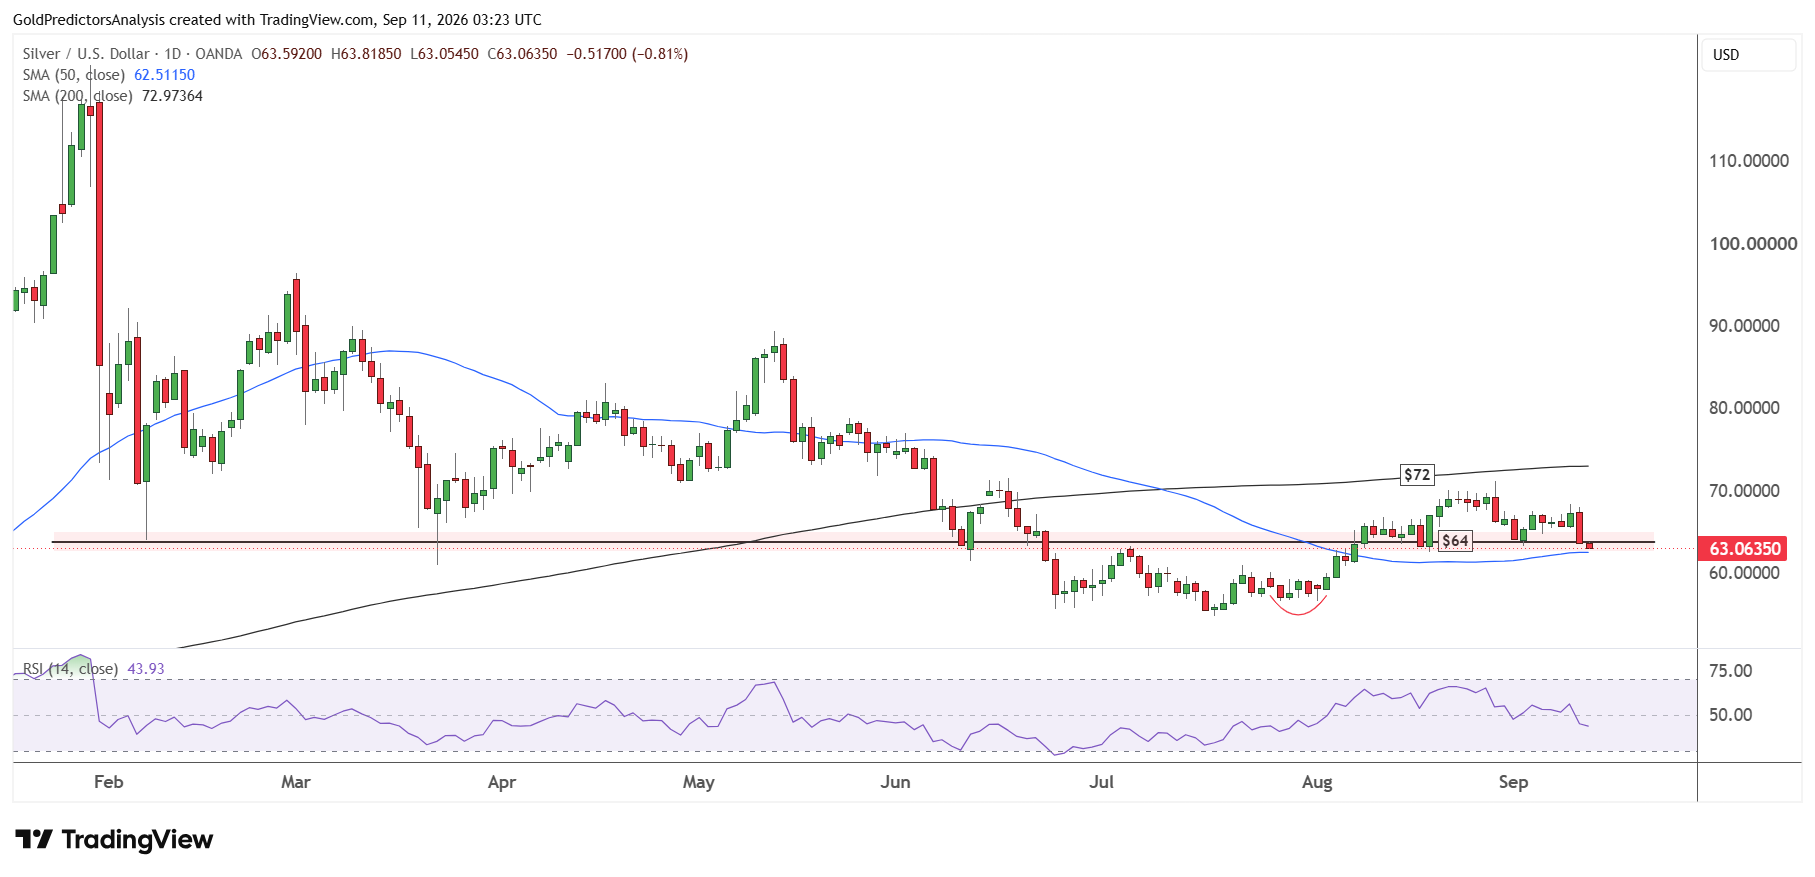
The daily chart for spot silver shows that the price dropped by 5.51% on Thursday and produced a negative daily candle. But the price remains above the 50-day SMA, which lies at $62.50. A break below the $62-$62.50 zone will likely trigger a drop back to $60 in the short term. But the increase in expectations of rate hike will likely keep gold and silver prices under pressure in the short term.
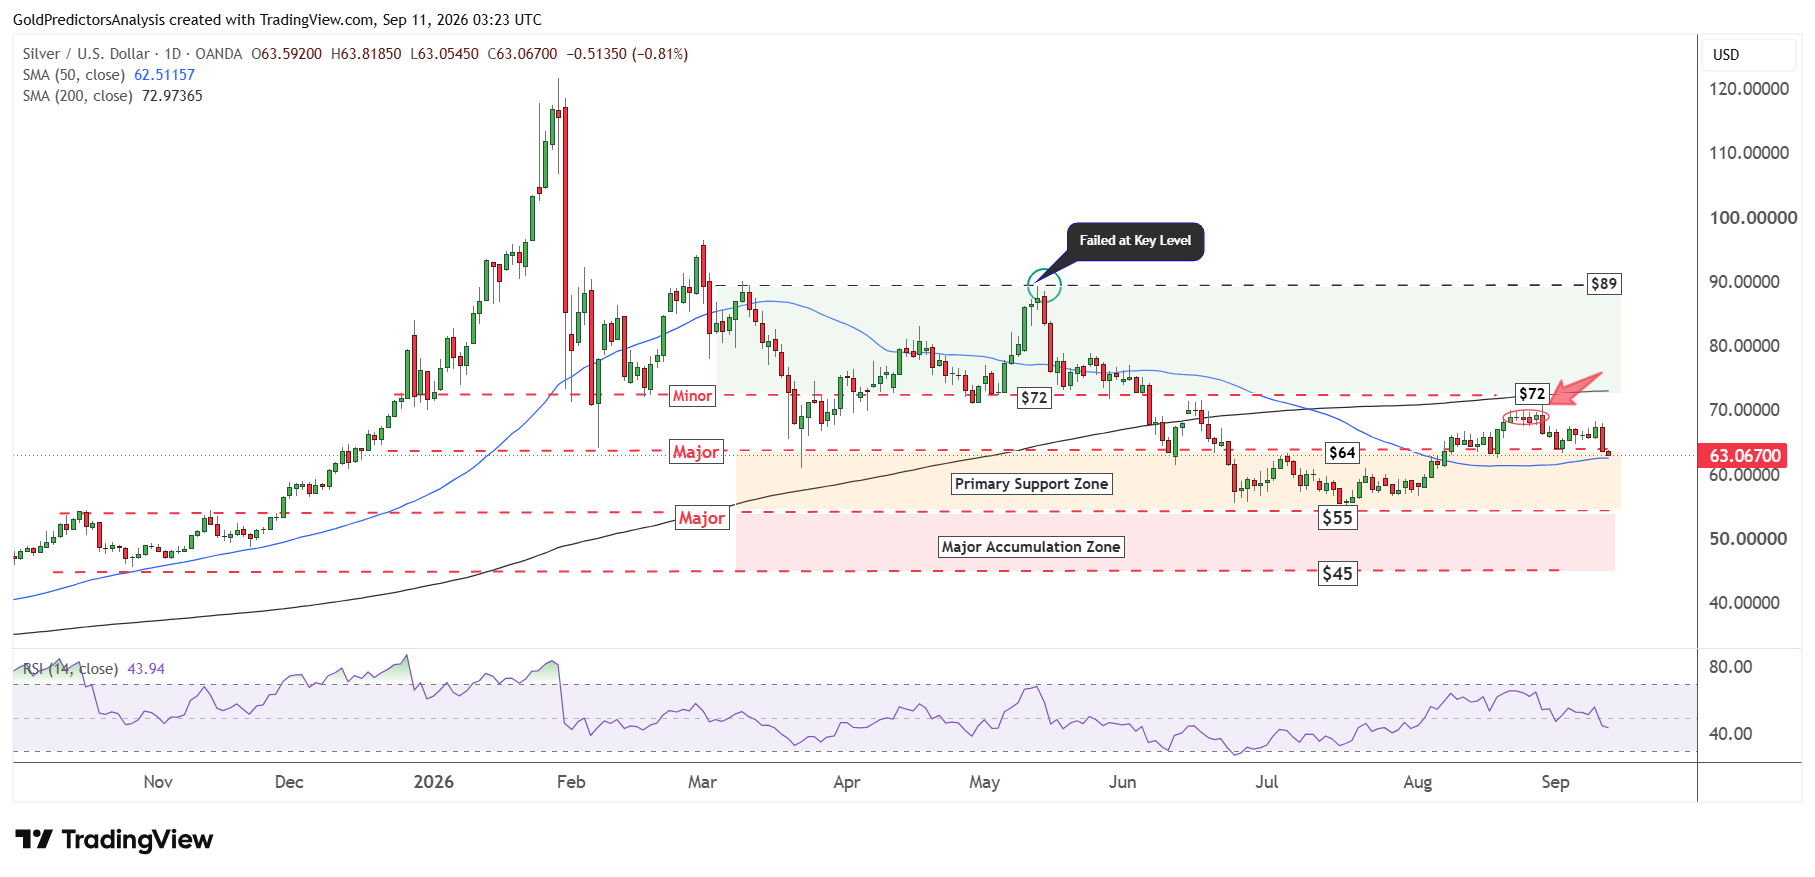
The importance of the current zone in spot silver is also shown in the chart below. The chart shows that the price is hovering around $64 an ounce and consolidating in a tight range. It requires a confirmed break below $62 to trigger the next move. But the RSI remains below the midline, which suggests negative price action in the short term.
Silver Remains Between $62 Support and $72 Resistance
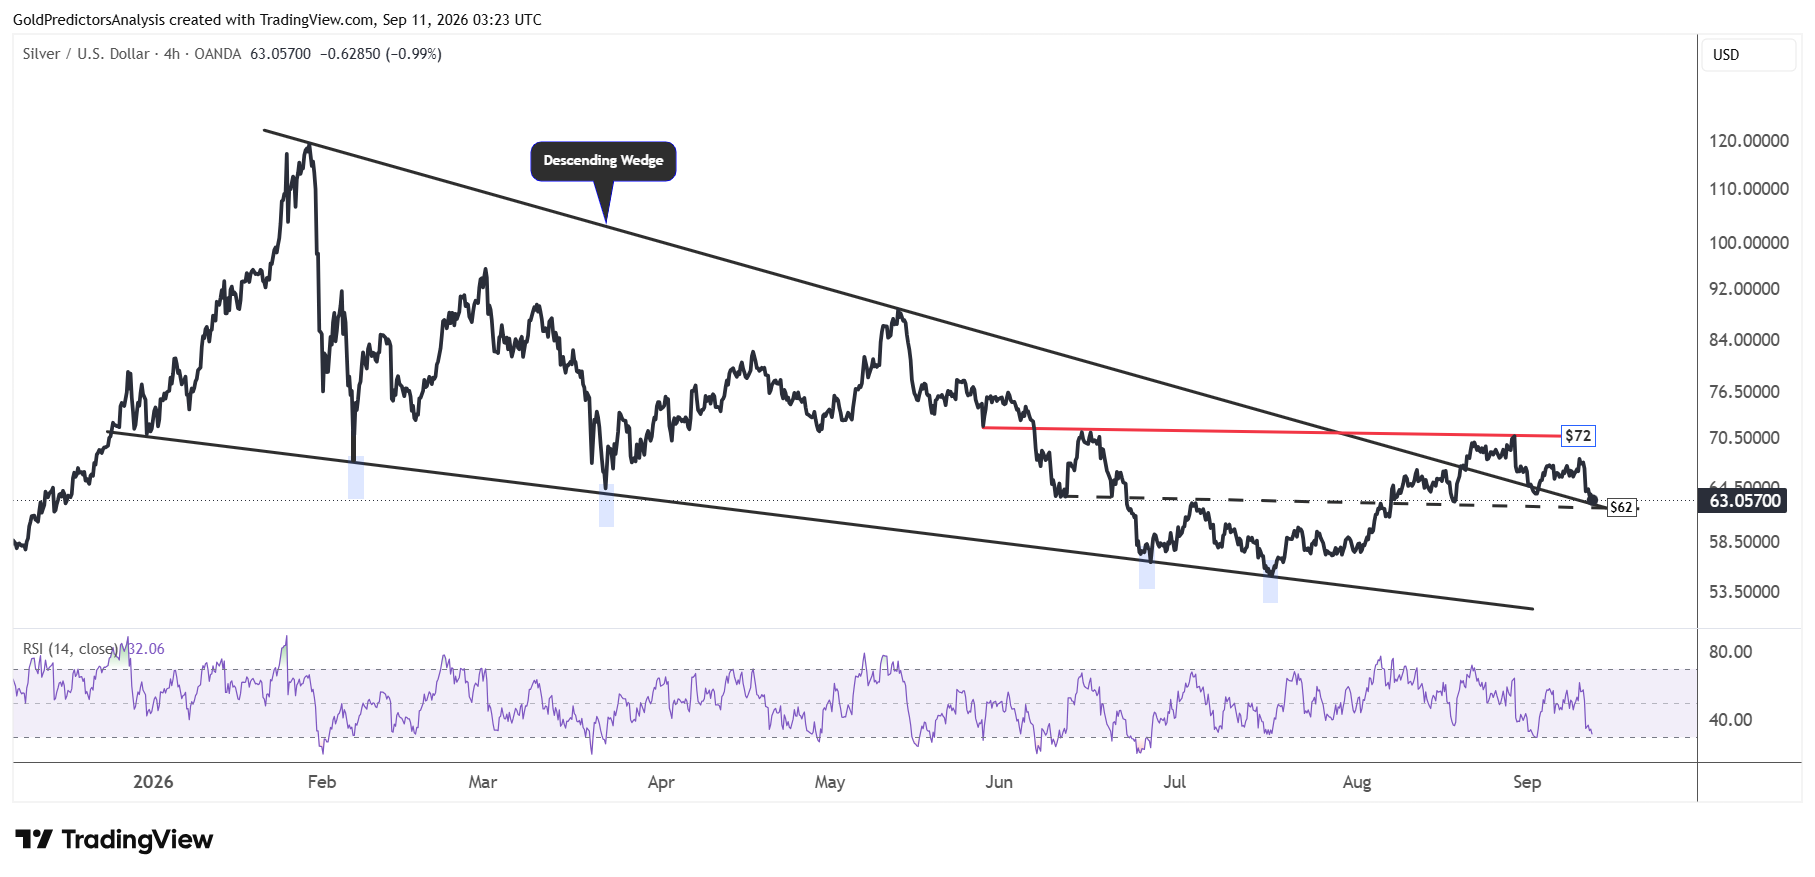
The 4-hour chart for spot silver also shows that the price has been consolidating between $62 and $72 after forming a peak near $72. A break below $62 will likely push the price into the descending wedge pattern and negate the bullish outlook. However, if the price holds the $62 level and rallies back toward $72, it will likely increase the likelihood of an upside breakout.
A confirmed break above $72 will likely push the price back towards the $90 area. However, a break below $62 will open the way for a strong drop towards the $55-$60 area in the short term.
What to Watch Next for Gold and Silver
Gold and silver remain under pressure in the short term as strong inflation and higher oil prices strengthen the expectation of a rate hike in September. The US CPI data on Friday could determine whether the selling continues. A hot reading may lift Treasury yields and the dollar while softer inflation could support the recovery in both metals.
Gold needs to hold support near $4,270 while silver must defend the $62 level. A break below these levels would increase the risk of further drop in both metals. In my view, buyers need stronger confirmation before a recovery can gain momentum. A break above $4,530 in gold and $72 in silver would strengthen the case for renewed gains.