



Critical Support Comes Into Focus
Gold deepened its short-term pullback on Thursday, falling to a six-day low of $4,324 and completing a 78.6% Fibonacci retracement of the recent advance at $4,331. Together with the lower rising trendline, the Fibonacci level identifies a potential support zone around the lower rising trendline. However, the zone is at risk of failing given the intraday break below the trendline during Thursday’s session.
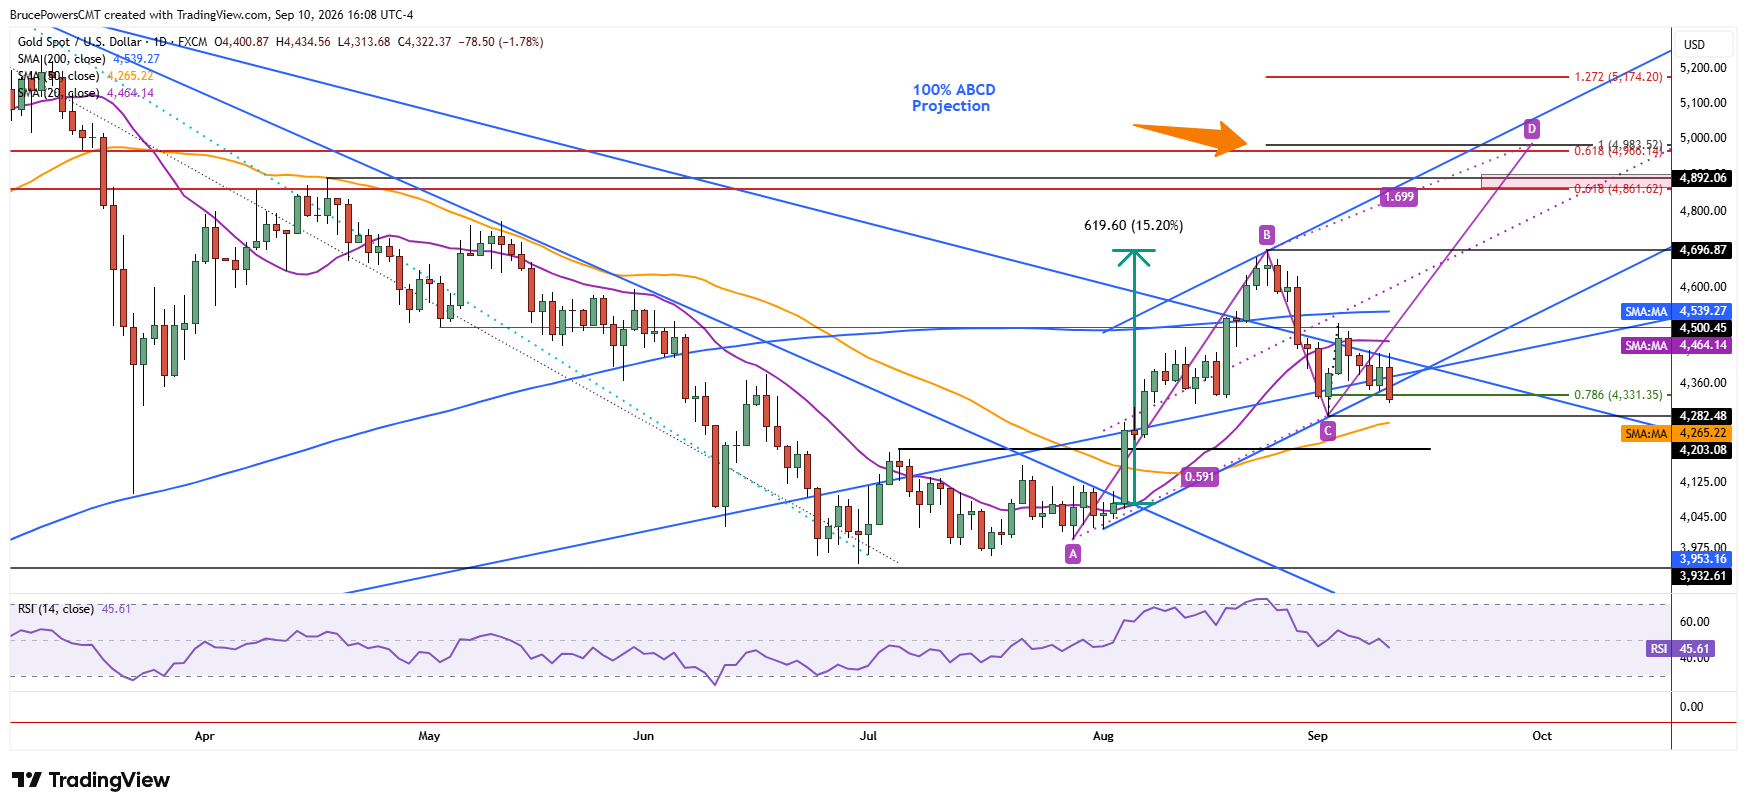
If the lower uptrend line fails to hold as support, the 50-day moving average, now near $4,266, becomes a downside target, along with the recent higher swing low of $4,282. Both the moving average and the prior low need to hold as support for the developing near-term bullish trend structure to be retained. That structure includes a swing high in August (B) and a higher swing low in September (C), with the 50-day moving average now providing key dynamic support for the advance.
August Breakout Faces Its First Major Test
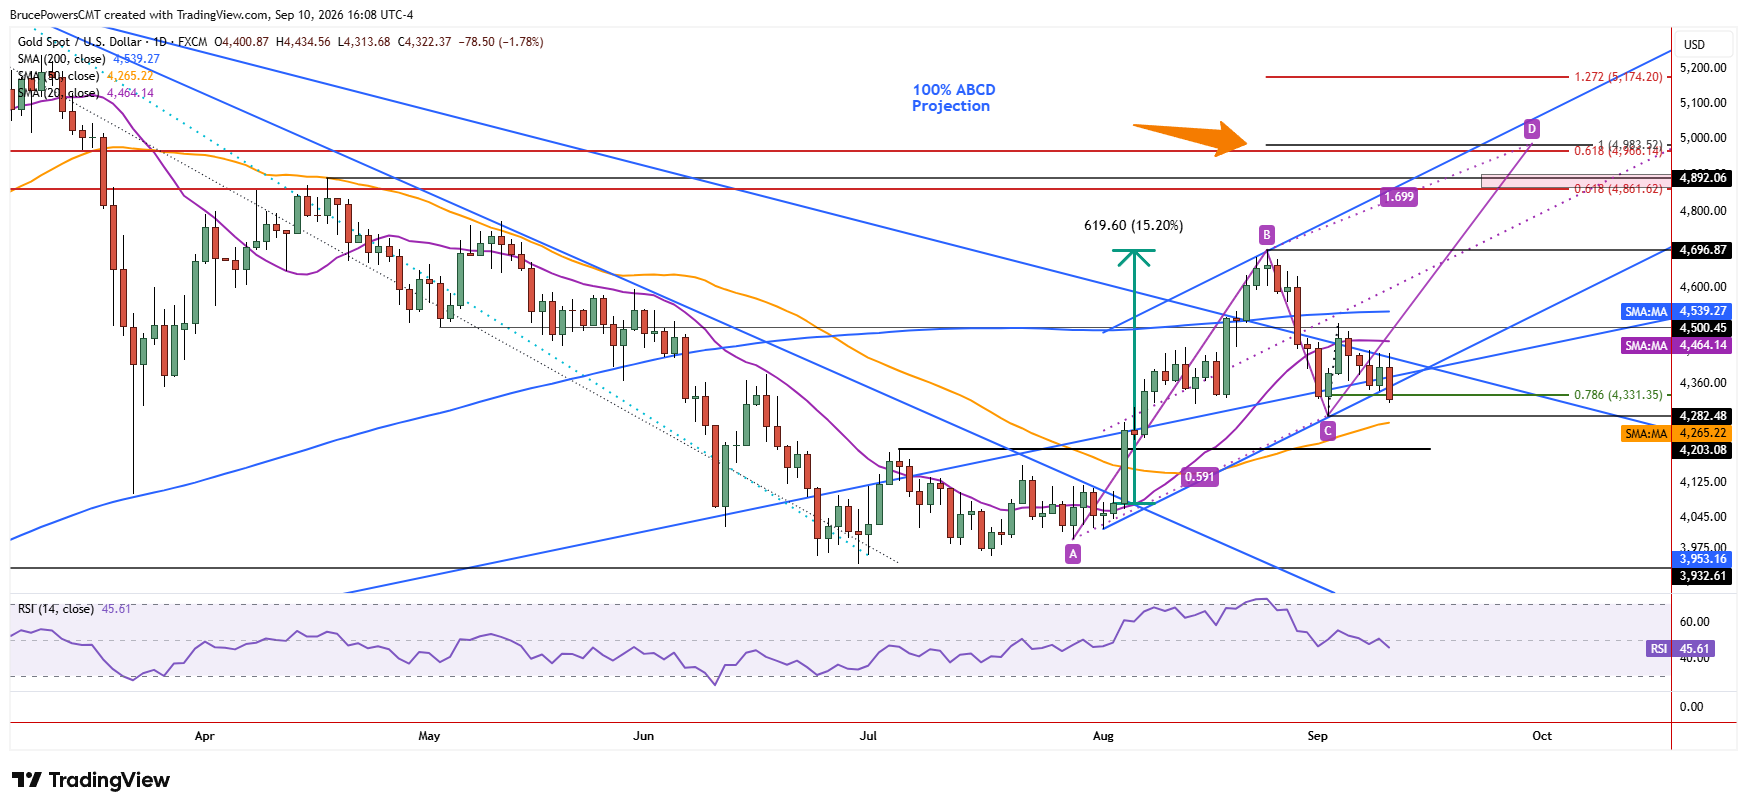
A sharp bullish reversal signal triggered above the 50-day moving average on August 5, followed by additional signs of strength and a sharp 15% rally to a high of $4,697 in late-August. The rally measured from the closing price on the day before the breakout to the late-August high. The larger pattern unfolding since then is a pullback to test prior resistance as support, first at the 50-day moving average and then potentially at the lower swing high of $4,203 from early-July, which was previously key resistance. Signs of support and improving demand at these levels would further validate the bullish reversal signal from early August.
Converging Signals Could Set Up Next Move
Gold is sitting in a narrowing range between support near the 50-day moving average and resistance at the 200-day moving average, now near $4,539. The current decline is the first test of the 50-day moving average as support since it was reclaimed in the August rally. Such a test is a normal and potentially healthy process for the developing uptrend, provided support holds. The narrowing distance between the two moving averages is constructive during consolidation, showing a contraction of the price range as potential demand builds.
This setup is particularly notable because the moving averages are converging along with a tight nine-day consolidation range at the intersection of two long-term trendlines, one rising and one falling, as well as the short-term uptrend line. A successful hold of support in this increasingly compressed structure would strengthen the case for the uptrend to resume.
If you’d like to know more about how to trade gold and silver, please visit our educational area.