


Gold (XAU) pulled back toward $4,350 amid rising oil prices, which added to inflation worries. The conflict in the Middle East has disrupted energy facilities and pushed oil prices higher.
Silver (XAG) may face similar pressure as it is also sensitive to the US dollar and interest rate expectations. A higher inflation reading will likely boost the dollar and push the Treasury yields higher. This may pull the silver price lower. Silver may face larger price swings as it is highly volatile. But if the global economic outlook remains strong, its industrial demand may offer some support.
The next move in gold and silver will likely depend on the upcoming US PPI and CPI reports. The strong inflation data may support the rate hike expectations in September and extend the decline in both metals. But softer data would help reduce rate hike expectations and support recovery in metals. The tensions between US and Iran may also create safe haven demand. In my view, gold and silver prices could remain volatile as markets balance geopolitical risk against the inflationary effect of higher oil prices.
Gold Price Forecast: $4,530 Breakout Could Open Path to $4,800
XAU/USD Consolidates Between 50-Day and 200-Day SMAs
Gold prices have been consolidating in a range after the drop following the strong jobs data last week. This consolidation indicates that the markets are waiting for the inflation data to find the next move.
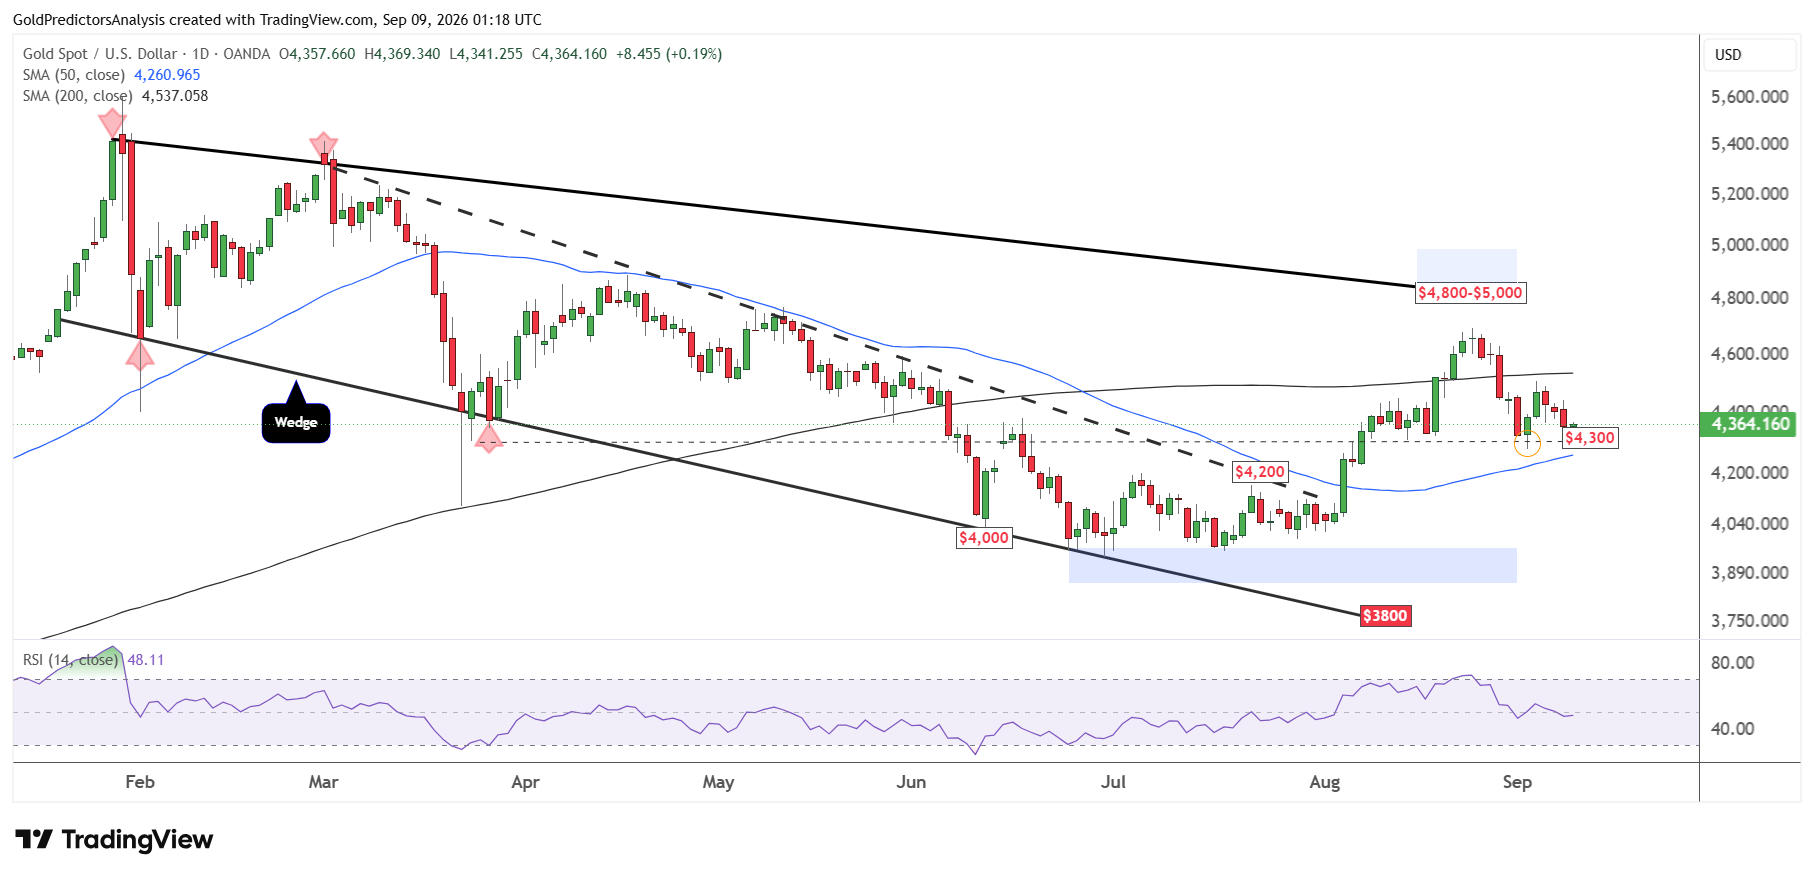
The daily chart for spot gold shows that prices have been consolidating between the 50-day SMA and the 200-day SMA. These moving averages range from $4,260 to $4,530. A break of either level will likely define the next move in gold.
A break above $4,530 will likely push prices toward the $4,800 area, which is defined by the resistance of the trendline of the descending wedge. But a break below $4,260 will open the way for a quick drop toward the $4,000 region.
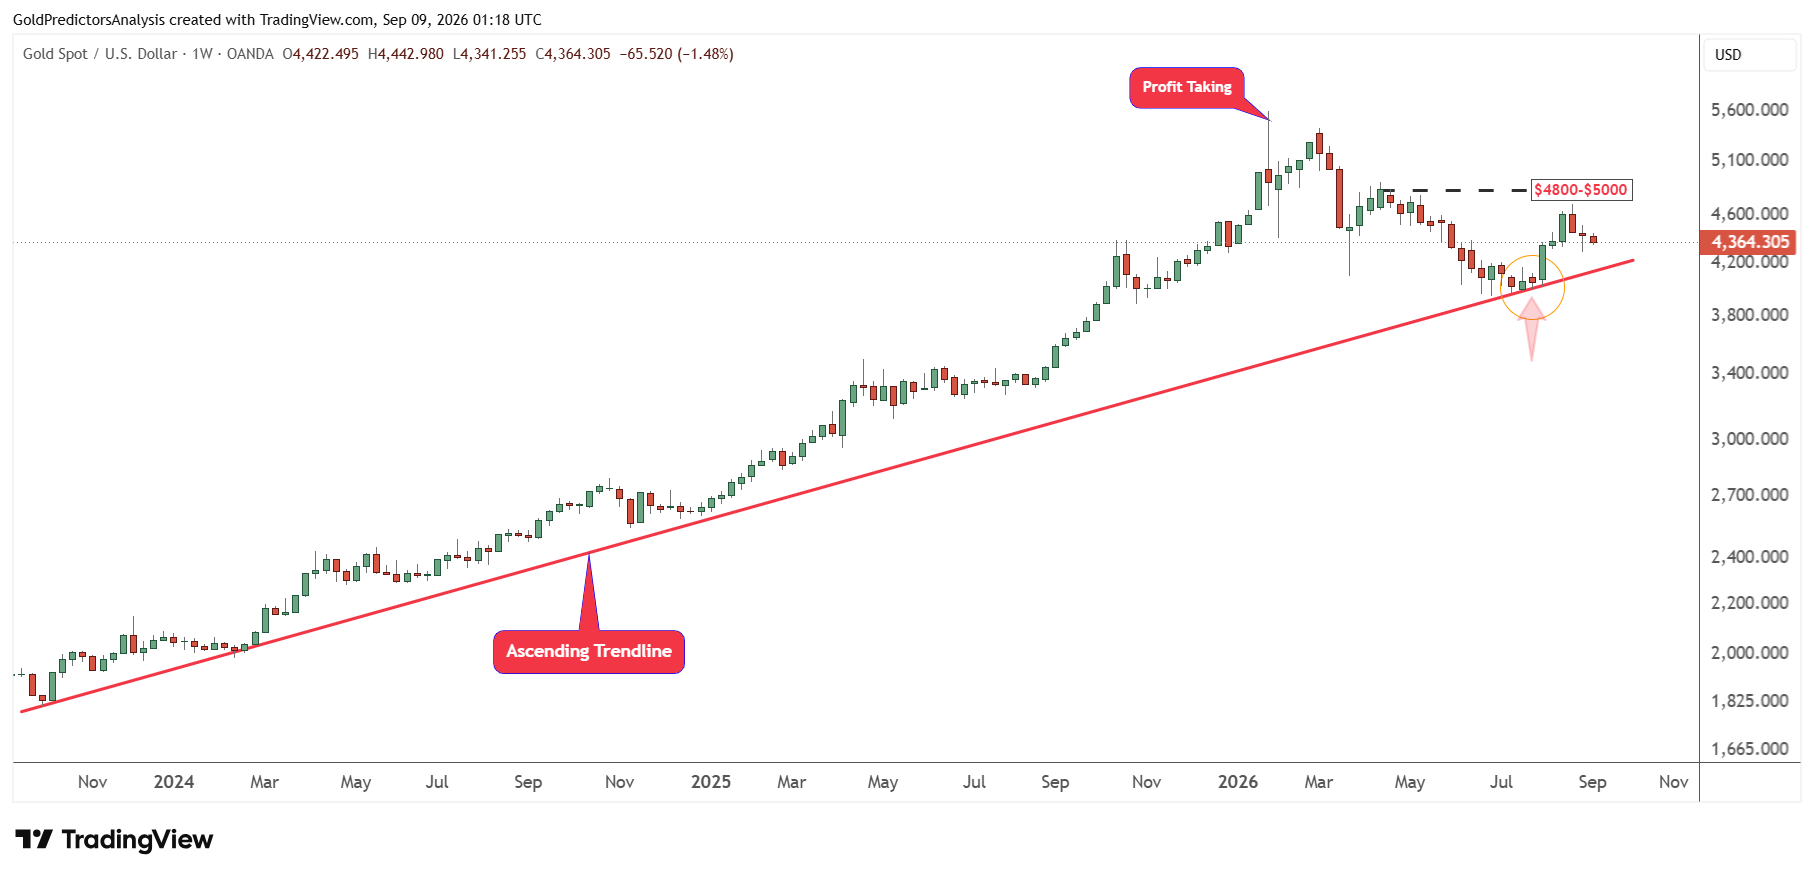
The weekly chart for spot gold also shows that prices created strong rebound in July after forming a low at $3,959. But the price must break above the $5,000 level to open the way for a strong rally in the gold market.
Gold Price Forecast
Every new Gold analysis as it publishes, today's technical signal and key levels, live price — on one page.
See all Gold forecastsShort-Term Gold Outlook: $4,300 Support Remains Critical
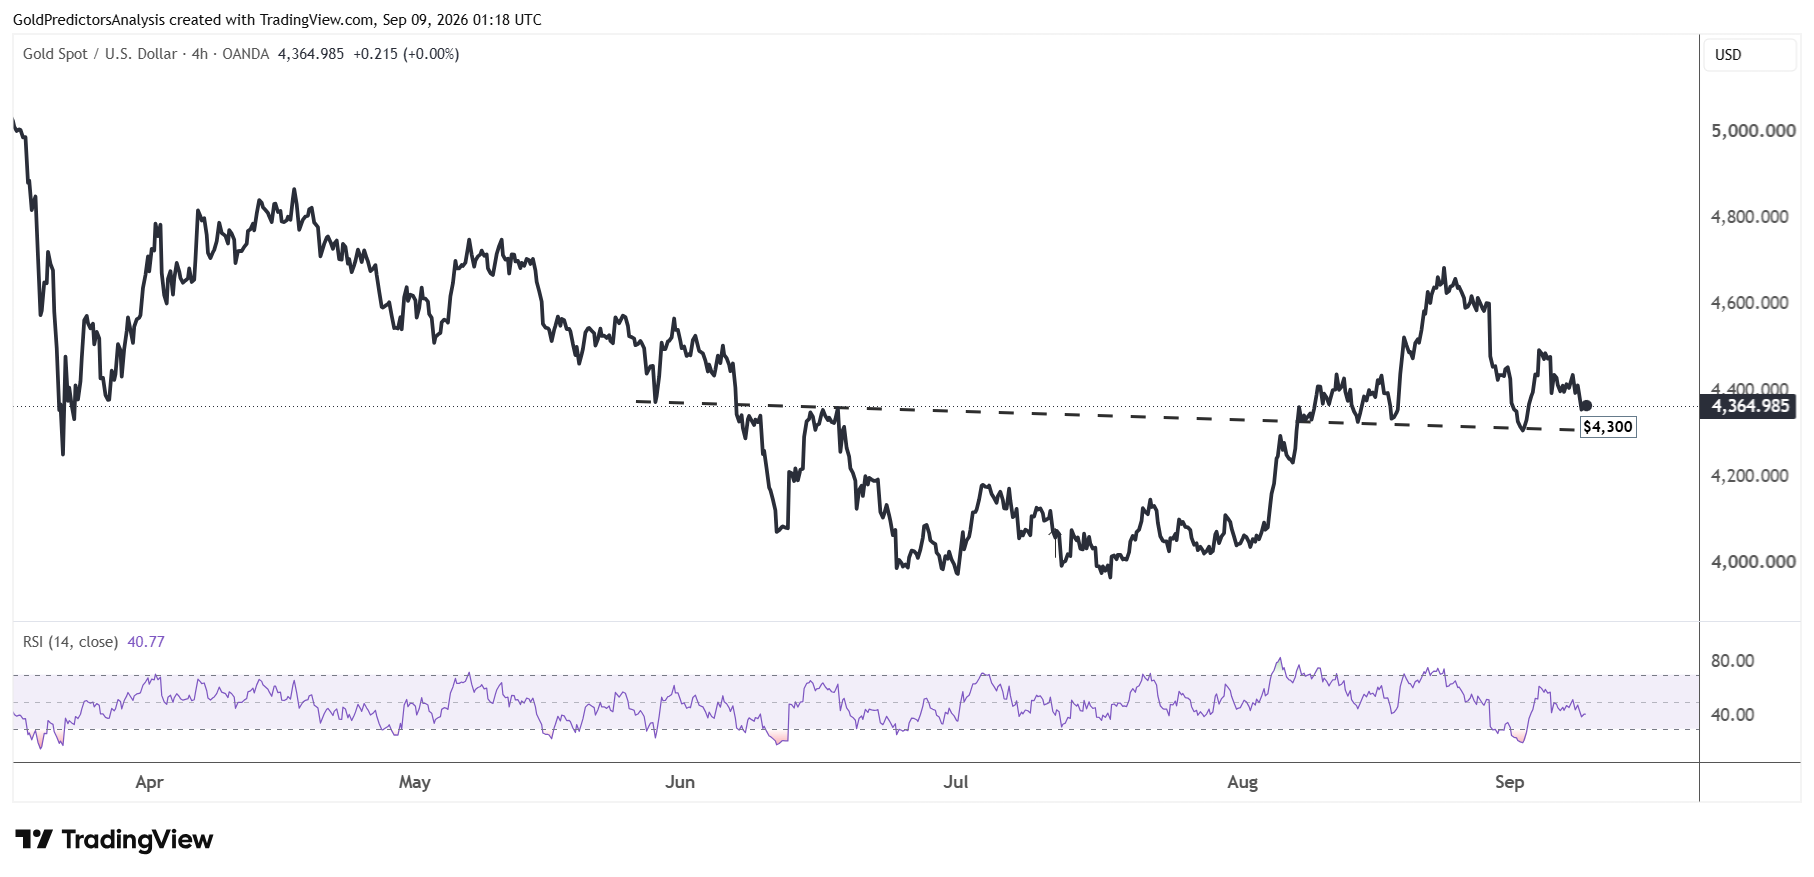
The 4-hour chart for spot gold also shows that prices have been consolidating above the $4,300 region. This level is defined by the support of the descending trendline that extends from June 2026.
A break below this level will open the way for another drop toward the $4,000 area. But the market must break above $4,530 to confirm the bullish price action in the short term. The RSI remains below the midline, which indicates uncertainty in the short term.
Silver Price Forecast: Break Above $72 Could Target $90
XAG/USD Retests Key Triangle Support Near $64
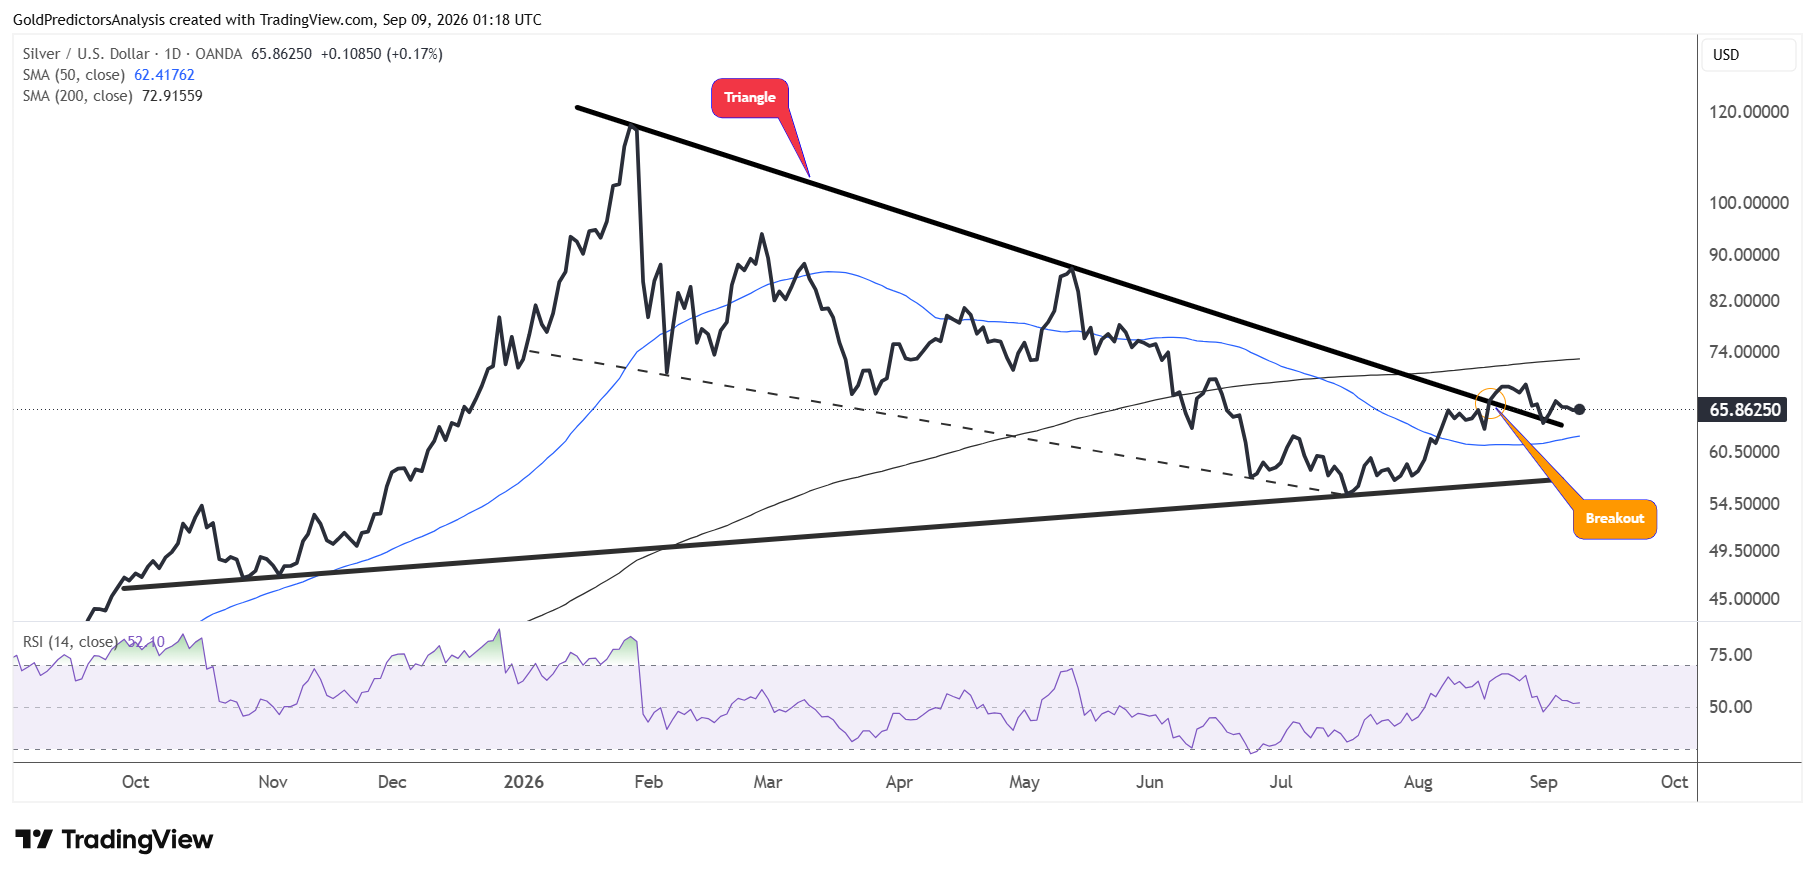
The daily chart for spot silver shows that the price already broke the triangle pattern in August 2026 around $67. But the price failed to break above the $72 region and dropped again to test the triangle support around the $64 region. The price is now consolidating in a bullish formation and looking for the next move.
A break above the $72 level is required for the silver market to push higher toward the $90 region. But a break below the 50-day SMA at $62 will likely break the support line of triangle and open the way for another drop toward the $55 area. The RSI remains above the midline on the daily chart which supports a positive outlook in the short term.
Silver Short-Term Outlook: $62 Support and $72 Resistance in Focus
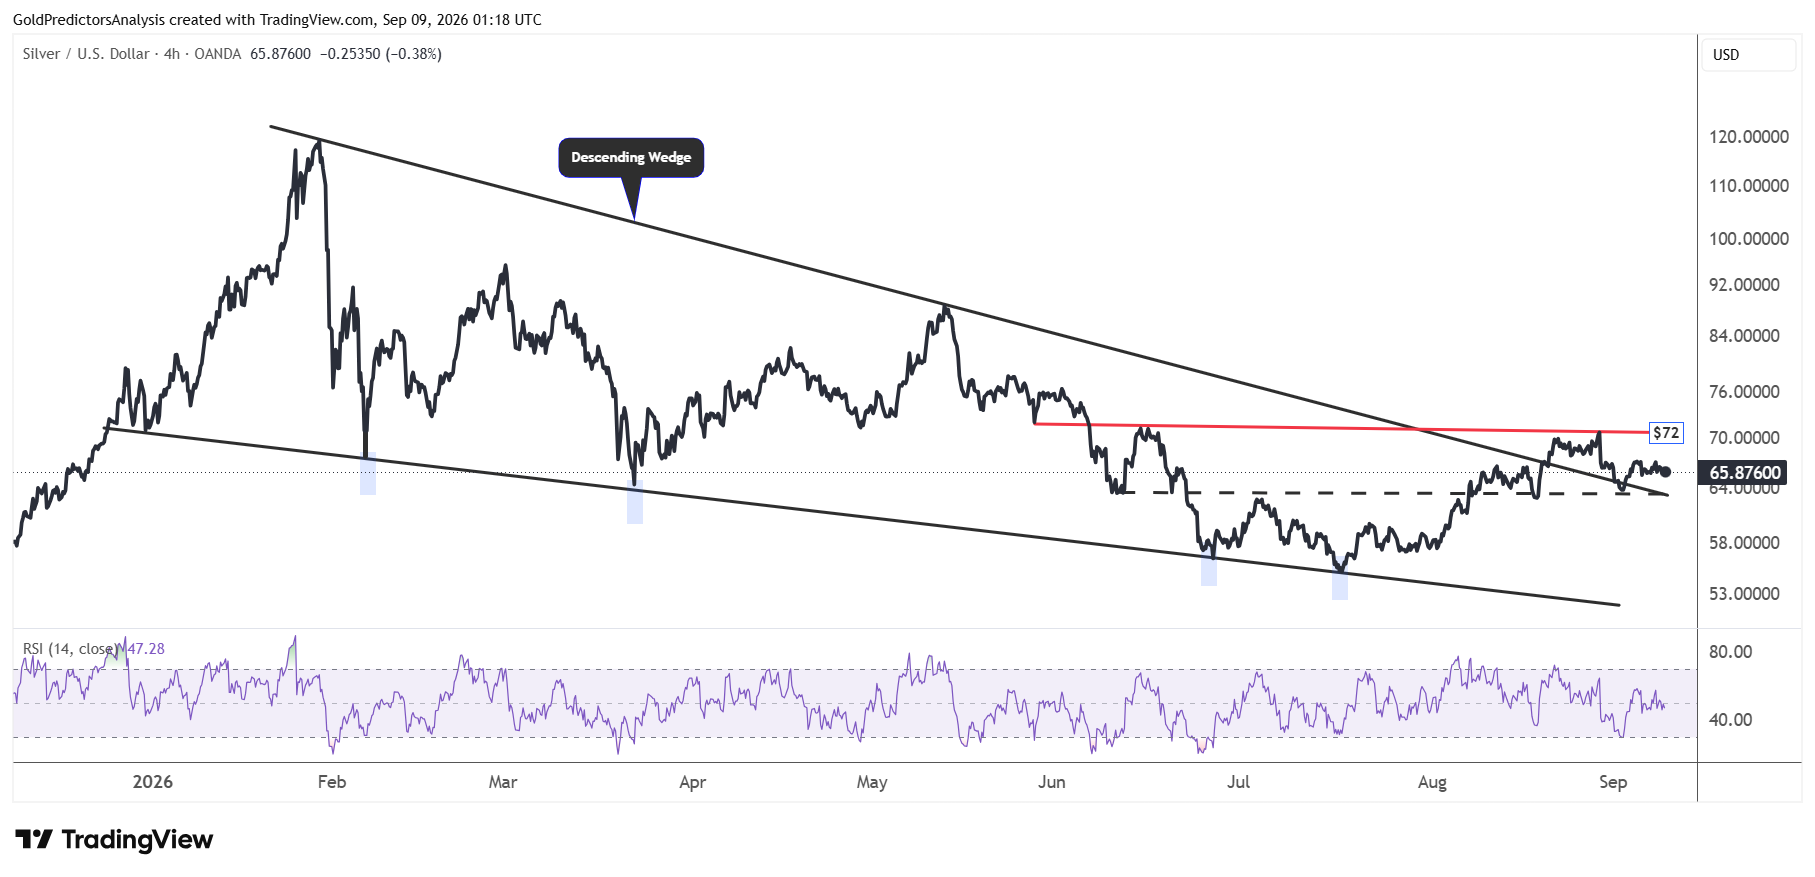
The 4-hour chart for spot silver shows that the price has already broken the descending wedge pattern. However, the price must now break above the red trendline around $72. A break above $72 will likely push spot silver to higher levels. However, a break below $62 in the short term will likely keep silver prices under pressure.
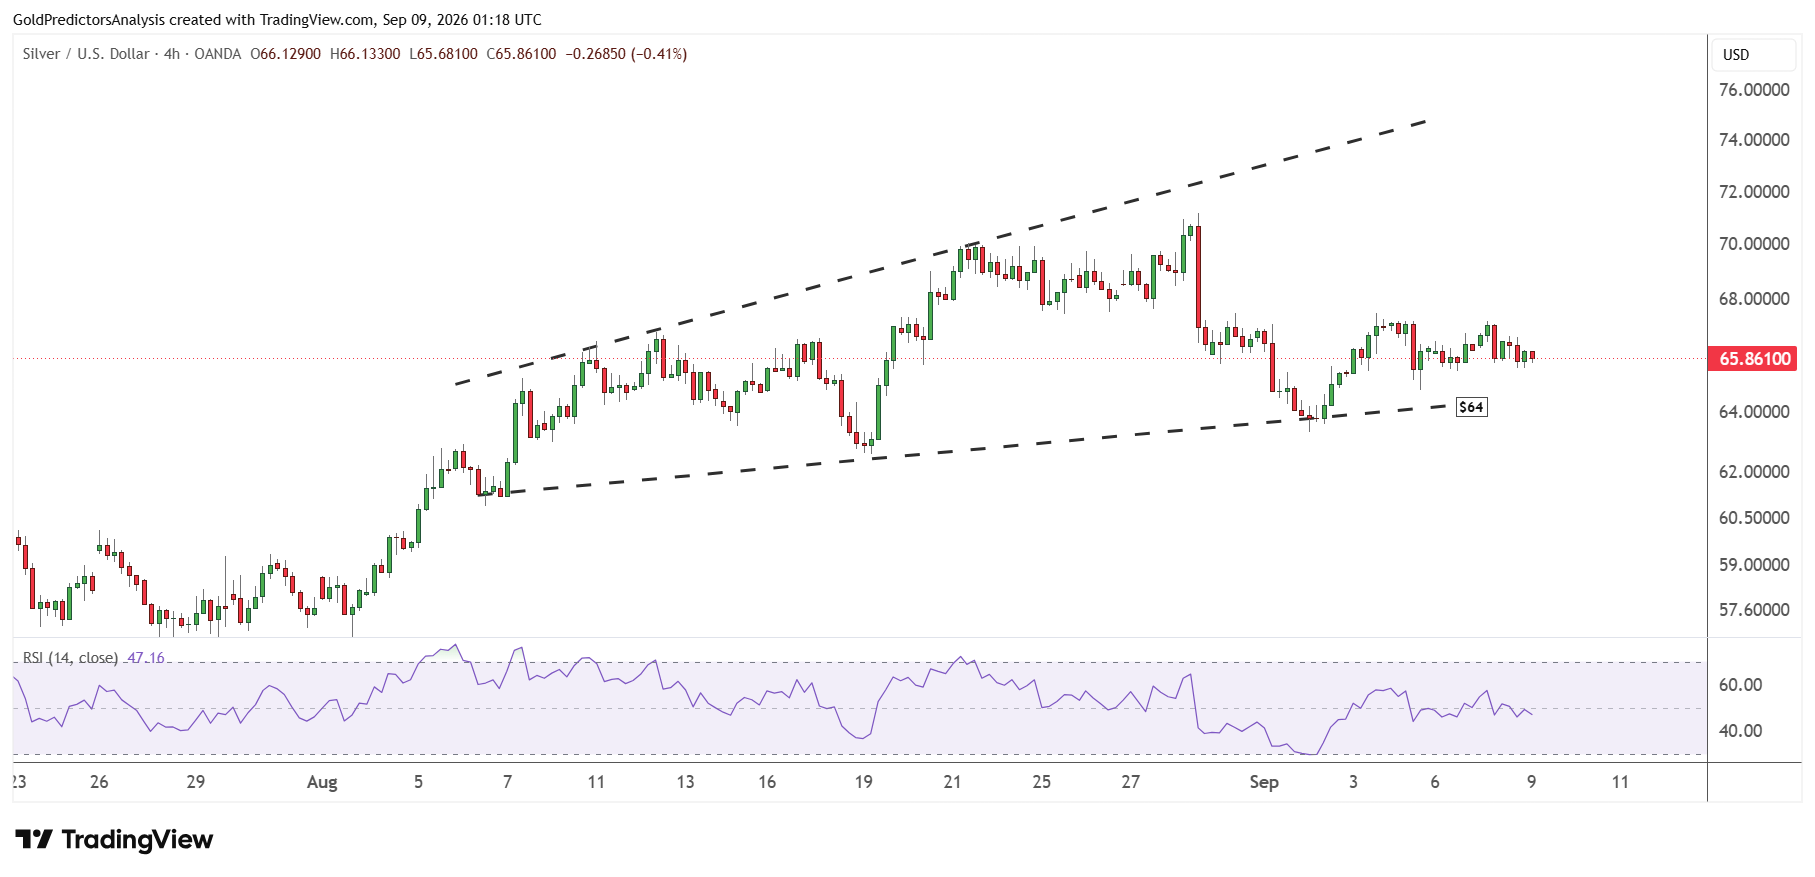
Another 4-hour chart for spot silver also shows the formation of an ascending broadening wedge pattern. This pattern highlights strong volatility in silver in the short term. Price remains neutral in the short term as the RSI is also consolidating around the midline.
What Is Next for Gold and Silver Prices?
Gold and silver remain at critical levels as markets wait for the US inflation data. Strong CPI and PPI readings could increase the expectation of a rate hike in September, lift Treasury yields and pressure both metals. But softer data could weaken the dollar and support a recovery. Gold must hold above $4,300 and break $4,530 to target $4,800. A drop below $4,260 could expose the $4,000 region in spot gold.
Silver needs to break above $72 to open the way toward $90 but a move below $60 could push it toward $55. In my view, both metals may remain volatile as rising oil prices increase inflation risks while geopolitical tensions support safe-haven demand.