


Tightening Range Signals Potential Move
Gold remained inside a three-day tightening consolidation range for a third day on Tuesday, while further testing resistance at the 20-day moving average. The tightening range, combined with repeated tests of resistance, suggests gold may be approaching a momentum move. Although the 20-day average has not yet been reclaimed, there has been little sign of sellers dominating the consolidation, suggesting sustained underlying demand.
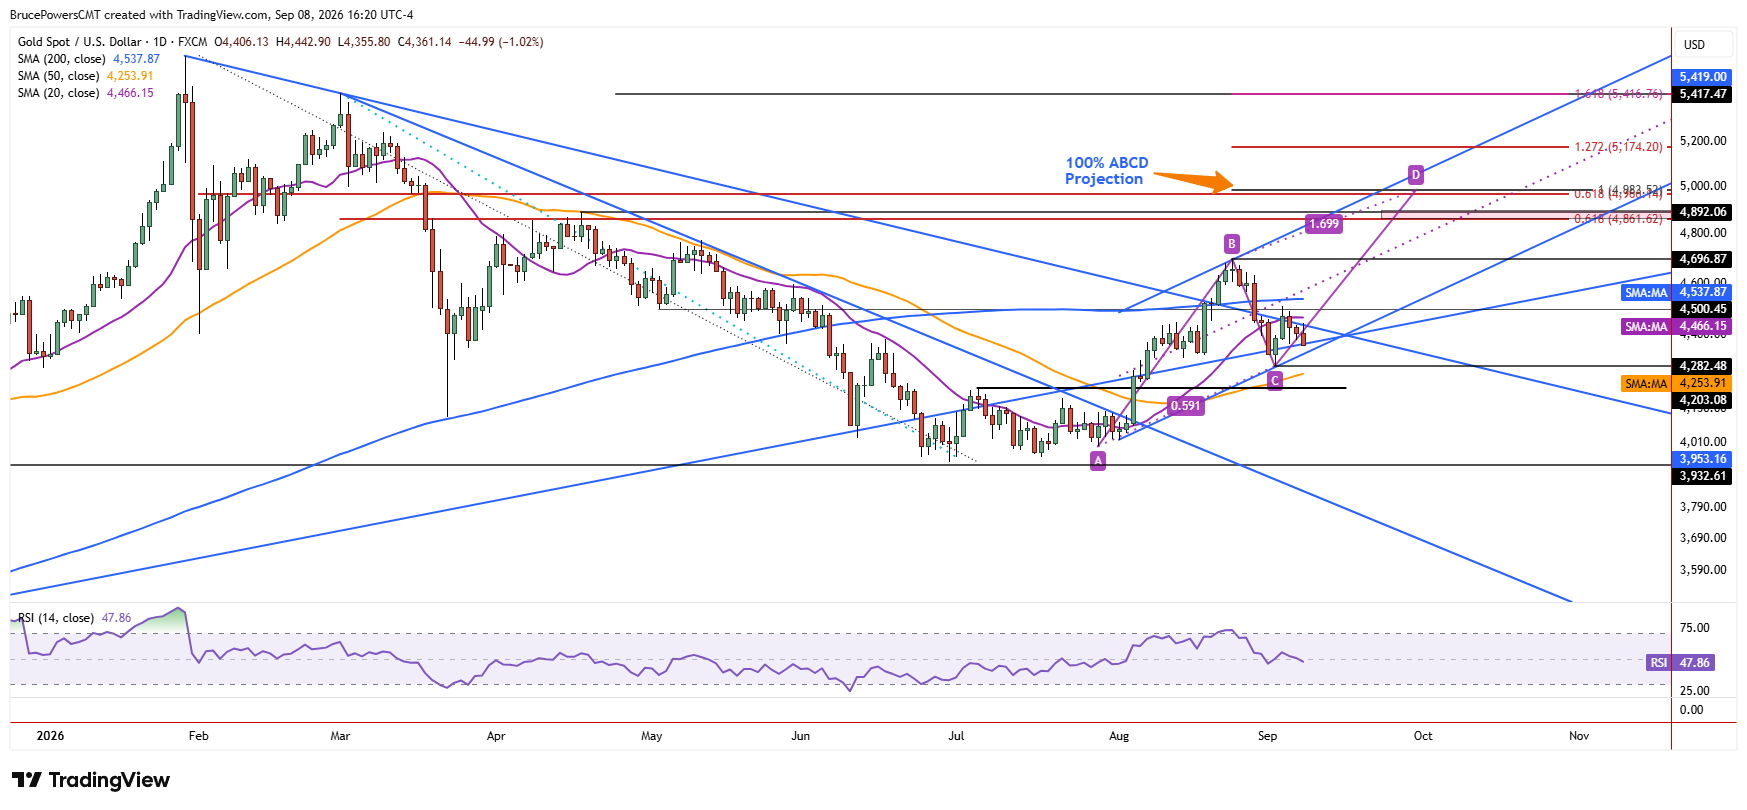
A decisive advance above Friday’s high of $4,491 would indicate strength, since the 20-day average would have also been reclaimed by then. However, the recent interim swing high of $4,511 is a more significant level since it ended the first leg higher from last week’s higher swing low of $4,282 (C), and a decisive move above it would signal continuation of the current advance.
Upside Targets Come Into Focus
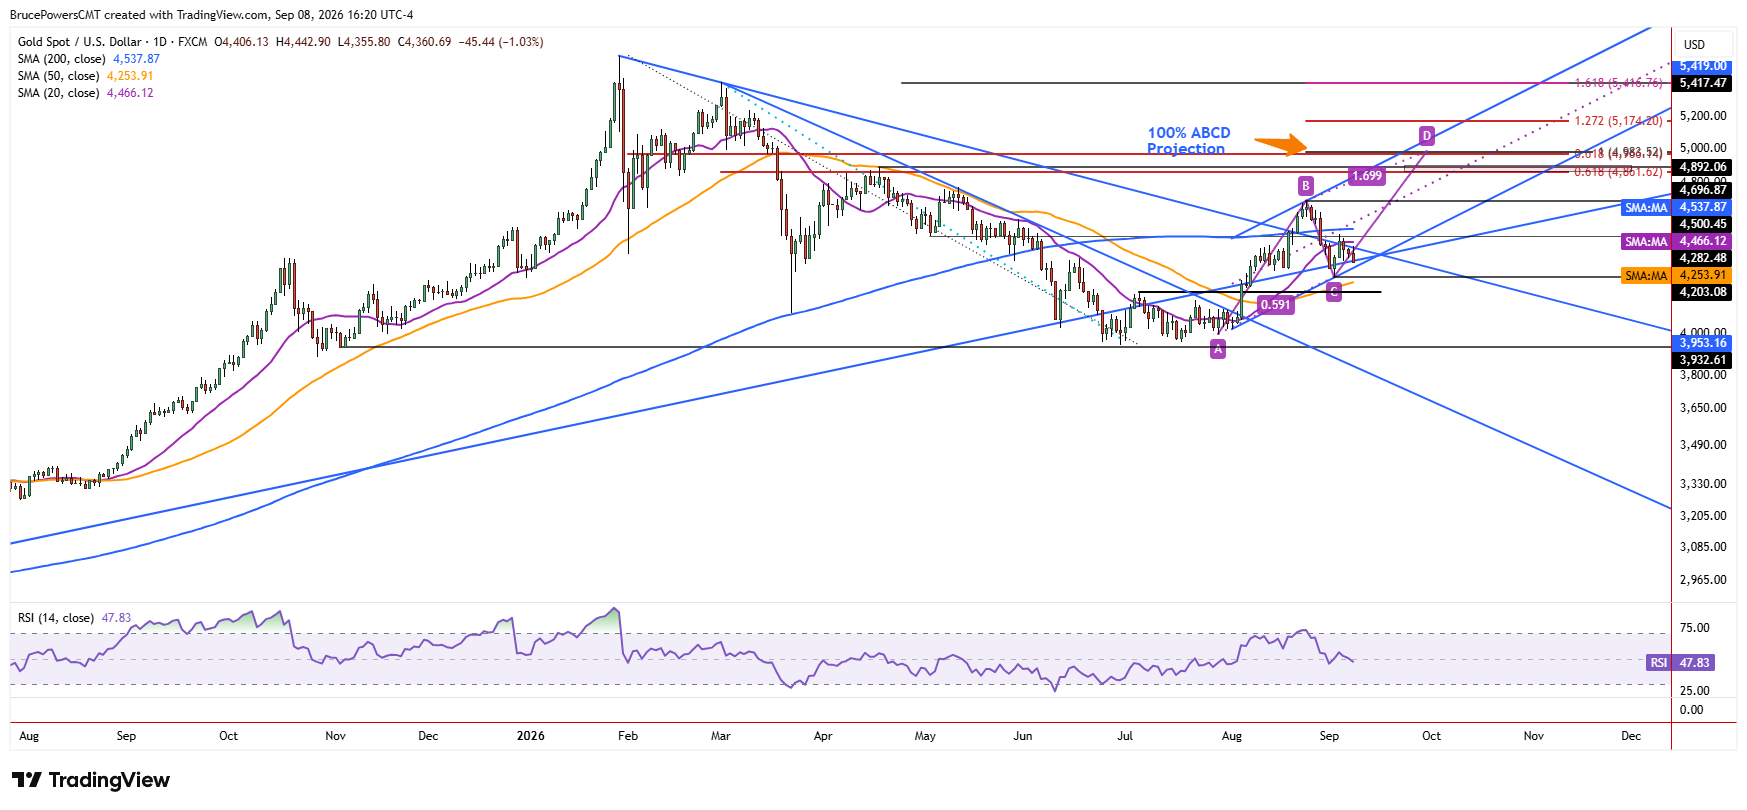
Initial key resistance is near the 200-day moving average at $4,538 but momentum triggered by a continuation of the short-term advance above the $4,511 high may be enough to reclaim it. A daily close above that high would add weight to the possibility of a developing ABCD pattern, with an initial 100% projection to $4,984. A slightly lower upside target zone from around $4,802 to $4,891 could be the next area where gold encounters resistance if the recent swing low at $4,282 is retained as support.
Trendline Compression Builds Pressure
Adding to the potential for strong momentum to accompany a breakout of the current consolidation are two major trendlines that cross in about a week. They also reflect the compression of price, which can precede a sharp momentum move. At the same time, short-term consolidation may not yet be complete and a drop below $4,365 would point to a test of a lower rising trendline at the lower boundary of a new bullish channel and potentially establish the next test of support.
Bullish Bias Faces a Key Test
Given recent bullish price action and a weekly hammer candlestick pattern from last week, the bias remains to the upside. A decisive advance above $4,511 would not only signal a continuation of the daily bullish structure but could also confirm the weekly bullish reversal signal of last week’s hammer. With gold compressing beneath key resistance, a breakout above $4,511 would therefore provide the momentum signal suggested by the tightening range in the opening paragraph.