


Higher Low Carves Falling Channel
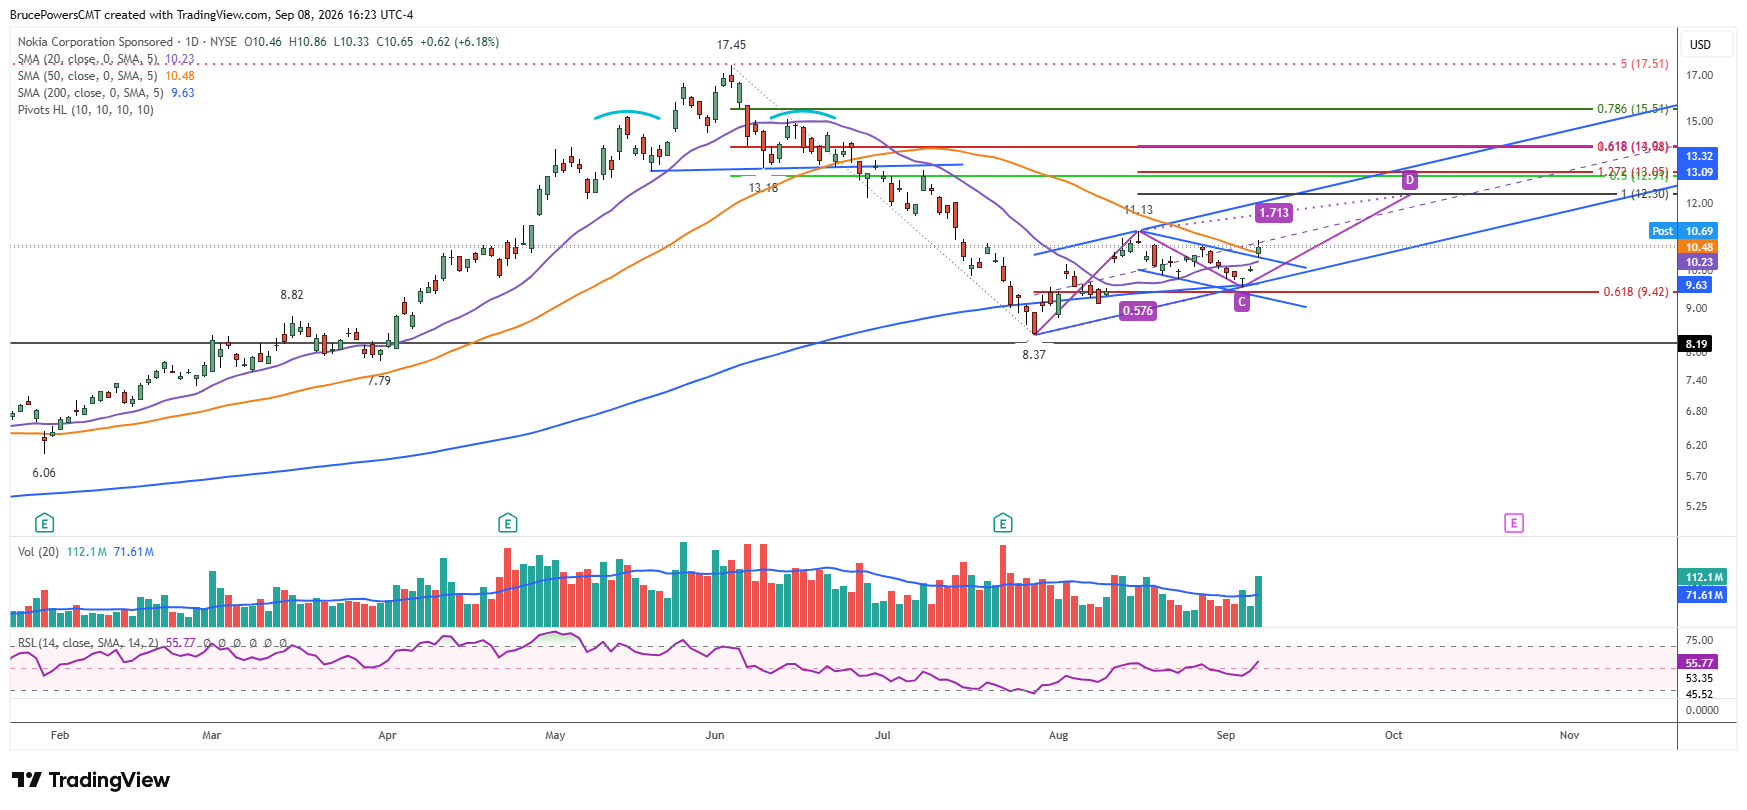
Shares of Nokia Corporation (NOK) signaled a continuation of the developing advance this week, establishing a higher swing low at $9.54. That followed the July higher swing low at $8.37 and a successful test of support at the 50-week moving average. There was one leg up after that low, to a swing high of $11.13 three weeks ago, which carved a small falling channel. An upside breakout of the channel triggered on Tuesday, with NOK confirming strength above the recent lower swing high of $10.66, as the 50-day moving average was reclaimed during the advance.
Tuesday Breakout Hints at Second Leg
That upside breakout of the falling channel shows the potential for a continuation of the developing advance. A second leg up may have just begun. Notably, Tuesday’s range was above the top boundary line of the channel and above the 20-day moving average once more, confirming strength. Volume on Tuesday was constructive, reaching a 13-day high that was above the 20-day moving average.
Buyers Reclaim Moving Averages
The reclaim of the 50-day moving average shows a change in character, as buyers continue to regain control following the sharp bearish correction to a low of $8.37 in late-July. Although the 200-day moving average failed to hold as support for a few days, it was quickly reclaimed and confirmed as support several times thereafter. Most recently, Friday’s higher swing low of $9.54 was a clear test.
Weekly Hammer Confirms Bias
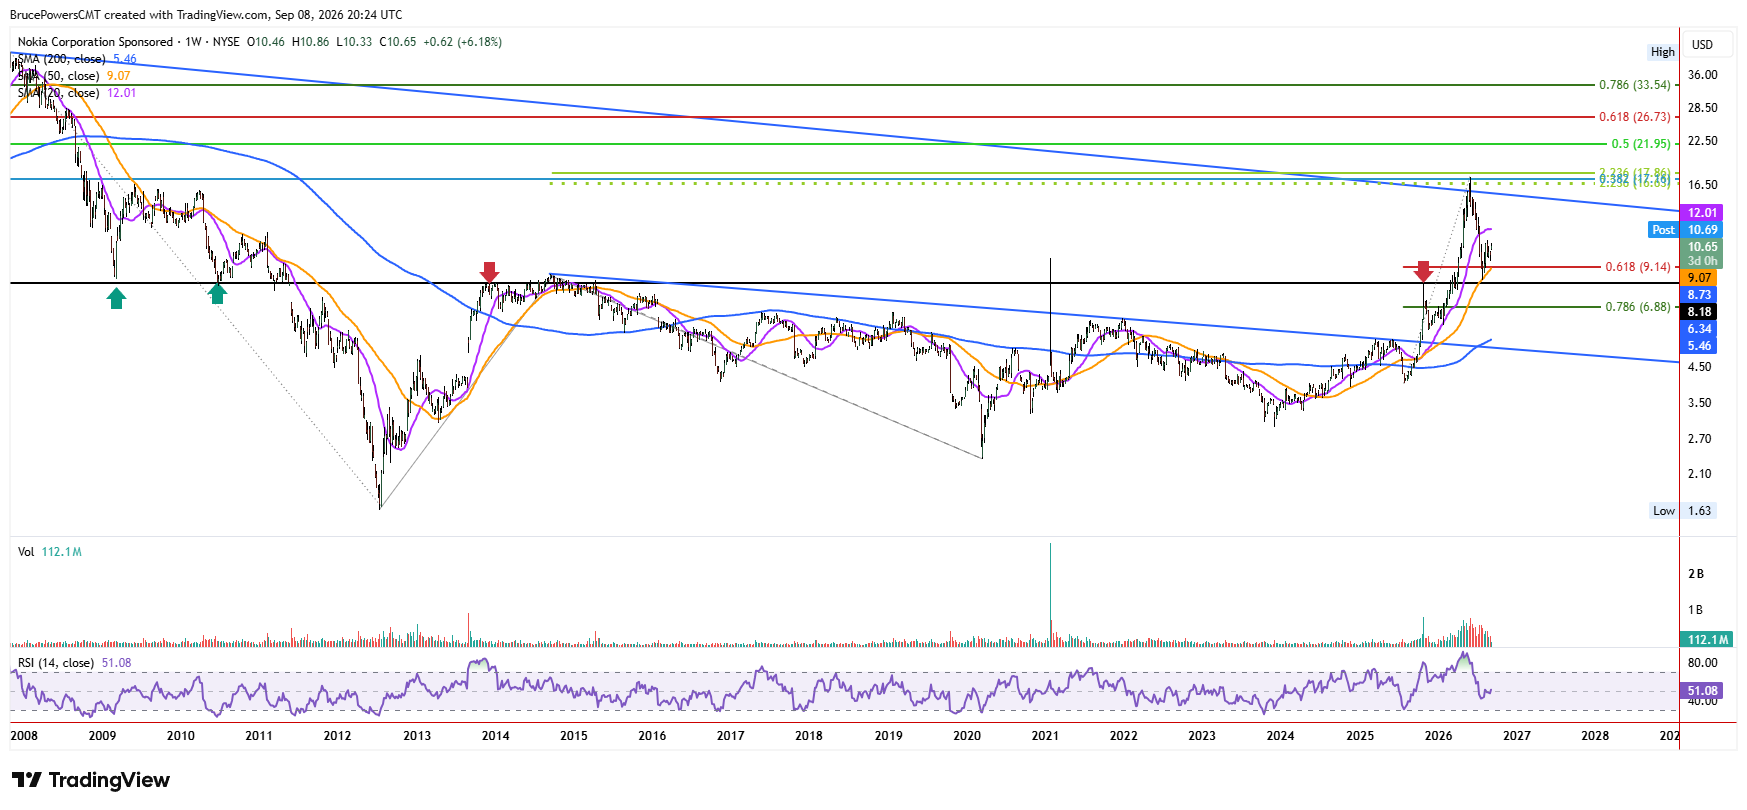
On the weekly chart, a bullish weekly reversal of a hammer candlestick pattern from last week triggered on a move above $10.28. This adds to the bullish technical evidence suggesting higher prices for NOK.
ABCD Projects Next Stops
The 50% retracement of the prior decline is at $12.91, while a 61.8% Fibonacci retracement lies at $13.98. Both levels identify potential upside targets, however, when adding a rising ABCD pattern onto the chart, a lower initial target level of $12.30 is indicated. That is where there is symmetry in price between the second and first legs up from the July bottom. Those measured objectives close the same loop that opened with the July higher low, the $9.54 swing low this week, and Tuesday’s channel breakout: the developing advance now has defined next stops if the second leg holds.