
Advertisement
Advertisement
NASDAQ 100 and Dow Jones 30 Forecast February 27, 2017, Technical Analysis
Updated: Feb 25, 2017, 05:41 GMT+00:00
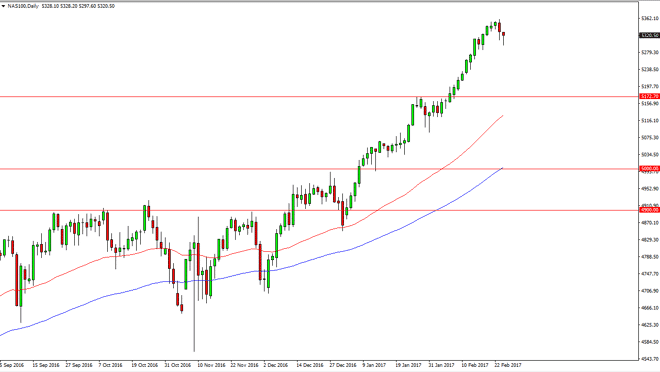
NASDAQ 100 The NASDAQ 100 pulled back during the day on Friday, but found enough buyers to turn things around to form a nice-looking hammer. However, the
NASDAQ 100
The NASDAQ 100 pulled back during the day on Friday, but found enough buyers to turn things around to form a nice-looking hammer. However, the weekly candle is a shooting star so I think we could see a continuation of the negativity and the short-term. However, I have no interest in selling I believe that pullbacks offer value.
NASDAQ100 and Dow Jones 30 Video 27.2.17
Watch our NASDAQ 100 and Dow Jones 30 Video Forecast:
Dow Jones 30
The Dow Jones 30 fell initially during the day on Friday, but turned around to form a hammer. If we can break above the top of the hammer it looks like we will continue to go higher. On the other hand, if we break down from here, I think that the market will find more support at the 20,600 level as well. Either way, I have no interest whatsoever in shorting this market.
About the Author
Christopher Lewisauthor
Chris is a proprietary trader with more than 20 years of experience across various markets, including currencies, indices and commodities. As a senior analyst at FXEmpire since the website’s early days, he offers readers advanced market perspectives to navigate today’s financial landscape with confidence.


Advertisement