Key Insights

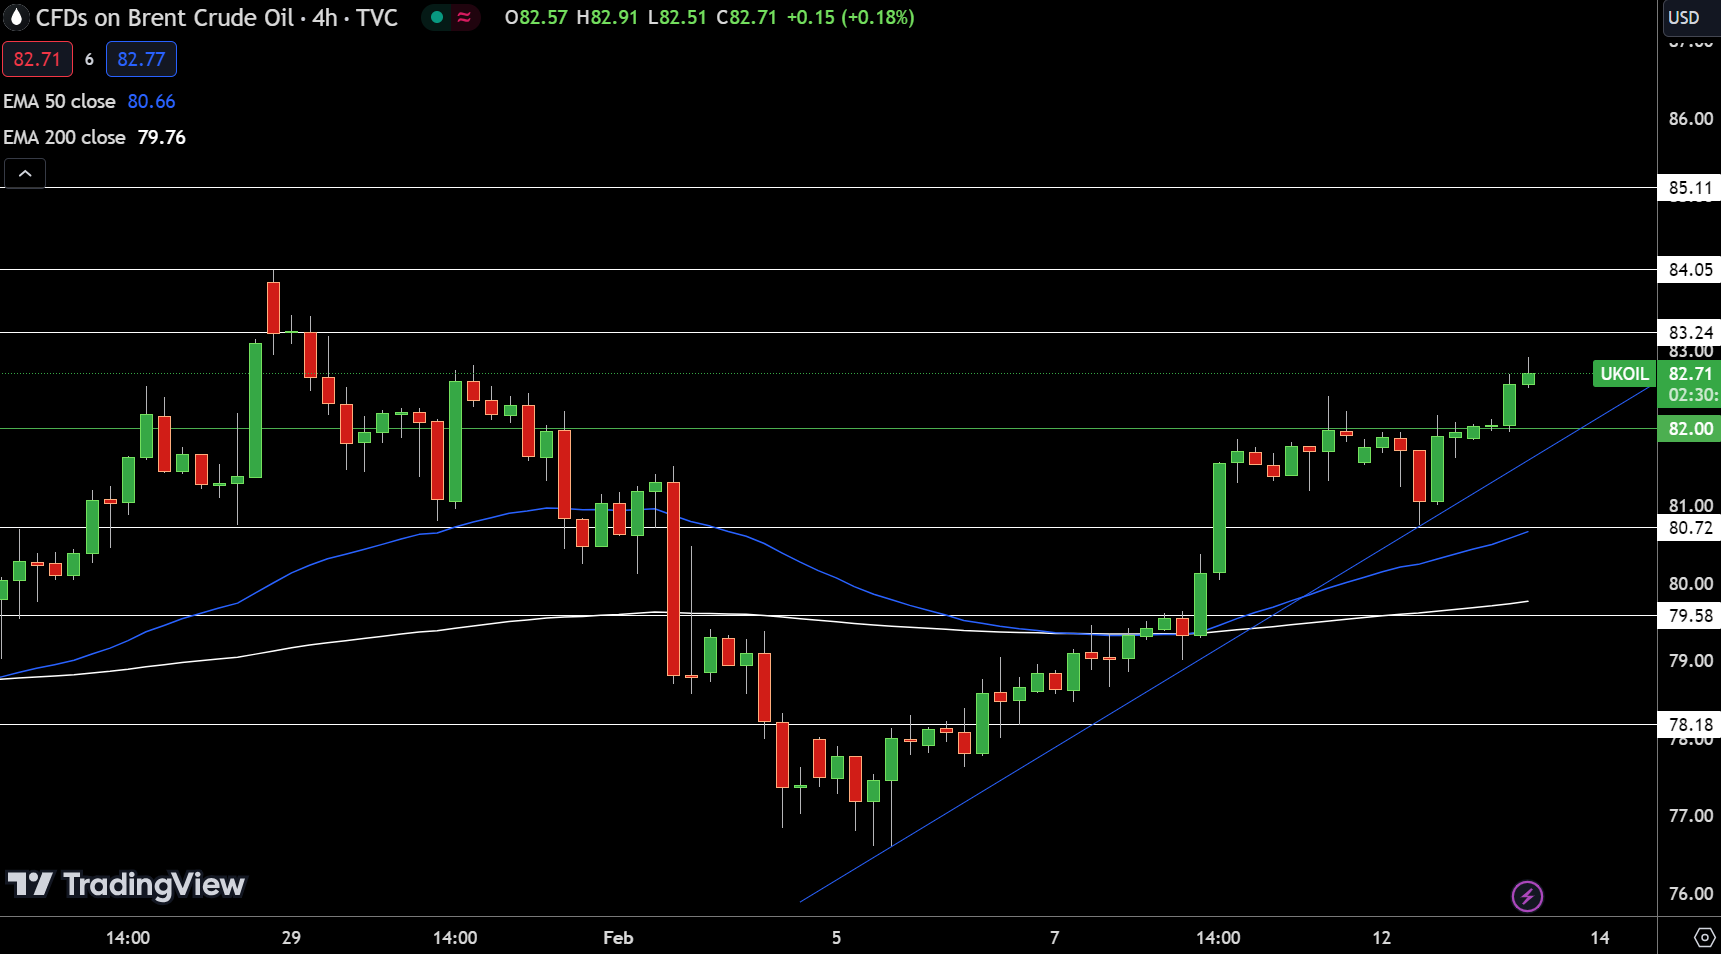
- Brent reaches $82.30, WTI at $77.23 amid Middle East tensions; interest rates curb gains.
- Natural Gas up 1.52%, struggles below $1.8410 pivot; market volatility affects outlook.
- WTI rises 0.84% to $77.53, UKOIL up 0.81% to $82.61; surpassing key resistances key for growth.
Oil Market Dynamics: Geopolitical Tensions and Economic Policies Shape Trends
Oil prices increased slightly on Tuesday, influenced by the ongoing conflict in the Middle East, with Brent futures reaching $82.30 a barrel and WTI crude at $77.23 a barrel. However, the anticipation of central banks maintaining higher interest rates to combat inflation has restrained these gains, potentially impacting energy demand negatively.
The situation in the Middle East, particularly the efforts towards a ceasefire in the Gaza Strip and the continuation of hostilities, has kept the oil markets volatile.
Additionally, the expectation of U.S. interest rates’ future path and upcoming economic data releases could further affect oil prices and demand. The market remains sensitive to geopolitical developments and economic indicators, indicating a complex influence on natural gas and oil analysis.
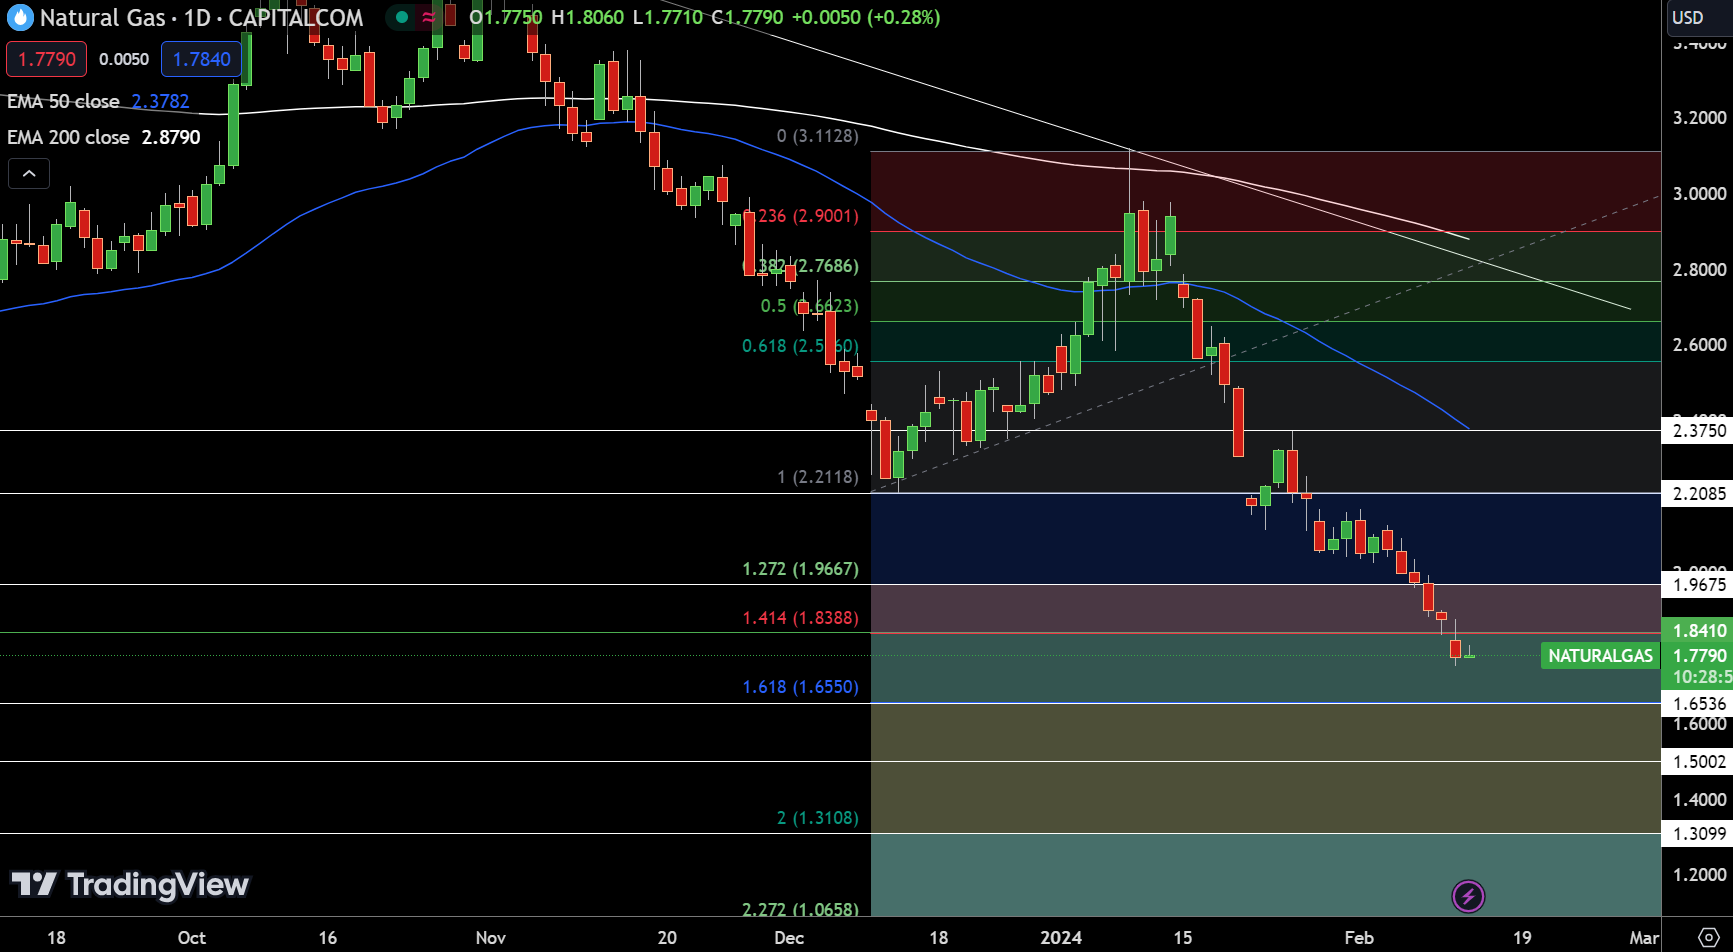
Natural Gas (NG) experienced a notable gain, closing at $1.8010 with a 1.52% increase. This movement showcases a potential shift in momentum, albeit still below the pivot point of $1.8410, suggesting a cautious outlook. Resistance levels are set at $1.9675, $2.2085, and $2.3750, indicating significant hurdles ahead for further advances.
Conversely, support is established at $1.6536, followed by $1.5002 and $1.3099, marking critical levels for maintaining current gains. The divergence between the 50-day and 200-day Exponential Moving Averages (EMAs), at $3.3782 and $2.8790 respectively, highlights the underlying volatility and market sentiment shift.
Despite the day’s positive performance, the overall trend remains bearish below the $1.8410 mark.
WTI Oil Price Forecast
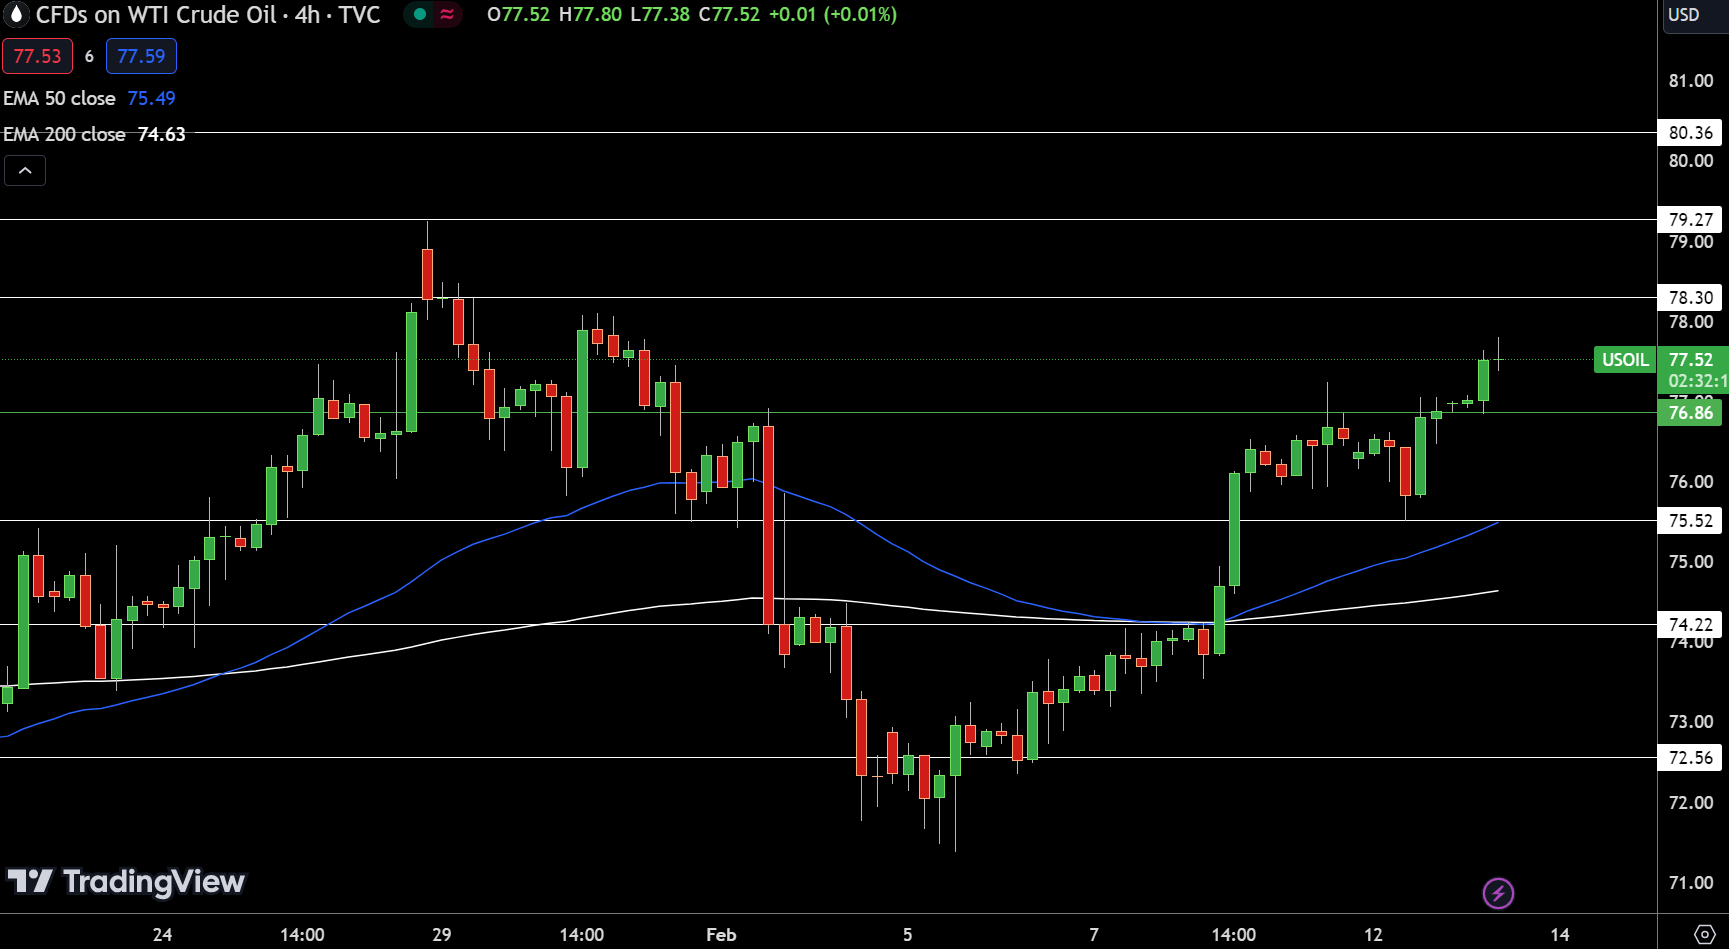
Resistance is projected at $78.30, $79.27, and $80.36, while support levels are established at $75.52, $74.22, and $72.56. The bullish trend is further supported by the 50-day and 200-day Exponential Moving Averages (EMAs), recorded at $75.49 and $74.63, respectively.
The observation of a double top pattern around the $77.40 level signals a point of resistance. Nonetheless, surpassing this level could perpetuate the prevailing buying trend, as evidenced by a bullish engulfing candlestick pattern.
Given this analysis, USOIL is portrayed optimistically, with continued performance above the $77.40 level indicative of possible future appreciations.
Brent Oil Price Forecast