
Global Oil Dynamics: Demand Concerns and Supply Risks
In Asian markets, oil prices remained stable amidst concerns over a dampened demand outlook and the ongoing Middle East conflict’s potential to disrupt supplies. Brent and West Texas Intermediate crude futures both saw modest gains.
Economic indicators from the U.S., Eurozone, and Japan are anticipated, with PMI data and Federal Reserve minutes expected to provide further insights into demand forecasts and interest rate policies.

The Fed’s stance suggests higher U.S. rates may challenge oil demand as economic growth cools. Meanwhile, Middle East tensions, underscored by the U.S.’s veto of a UN Gaza ceasefire resolution, continue to pose risks to oil supply stability.
Natural Gas Price Forecast
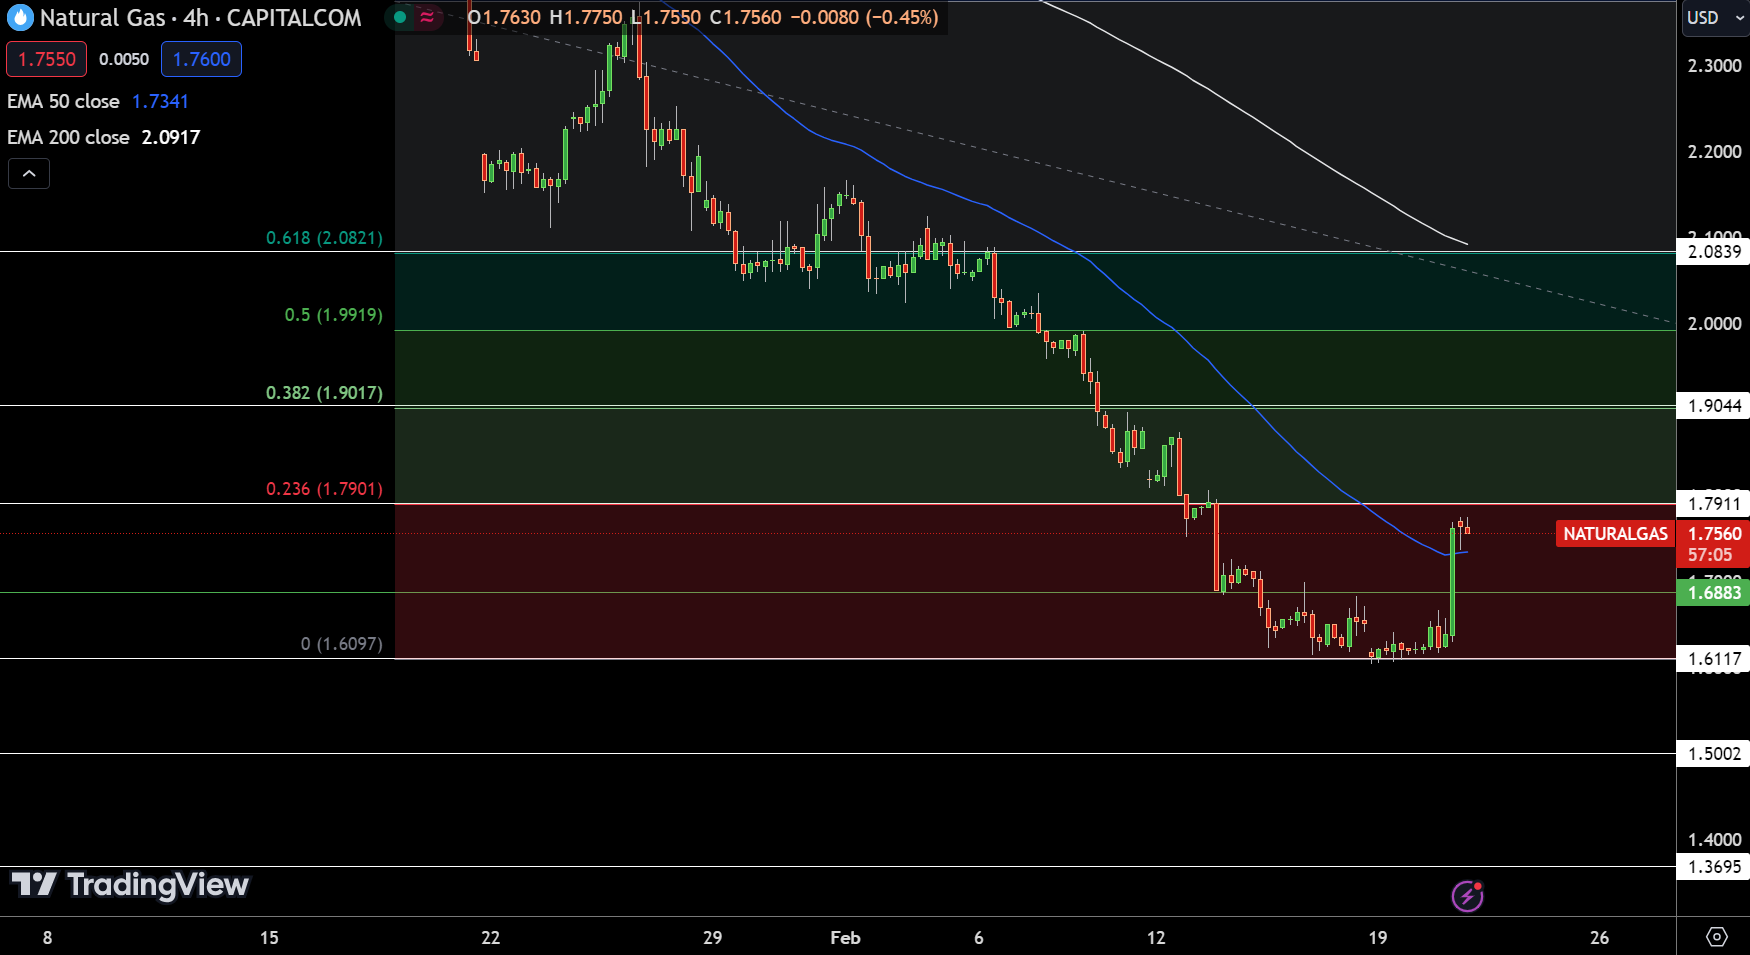
In today’s technical outlook for Natural Gas (NG) as of Feb 21, the commodity experienced a slight decline, trading at $1.756, marking a 0.40% dip amid bearish retracement. Overall it jumped over 8% on Tuesday. The pivot point stands at $1.69, serving as a threshold for determining the near-term trend direction. Immediate resistance is observed at $1.79, followed by further barriers at $1.90 and $2.08.
Conversely, support levels are identified at $1.61, with subsequent floors at $1.50 and $1.37. Technical indicators, including the 50-day Exponential Moving Average (EMA) at $1.73 and the 200-day EMA at $2.09, suggest a nuanced view.
The current positioning below the 200 EMA yet above the 50 EMA and pivot point underscores a mixed sentiment. The outlook is bullish above the pivot point of $1.69, indicating potential for upward movement if this level holds as support.
WTI Oil Price Forecast
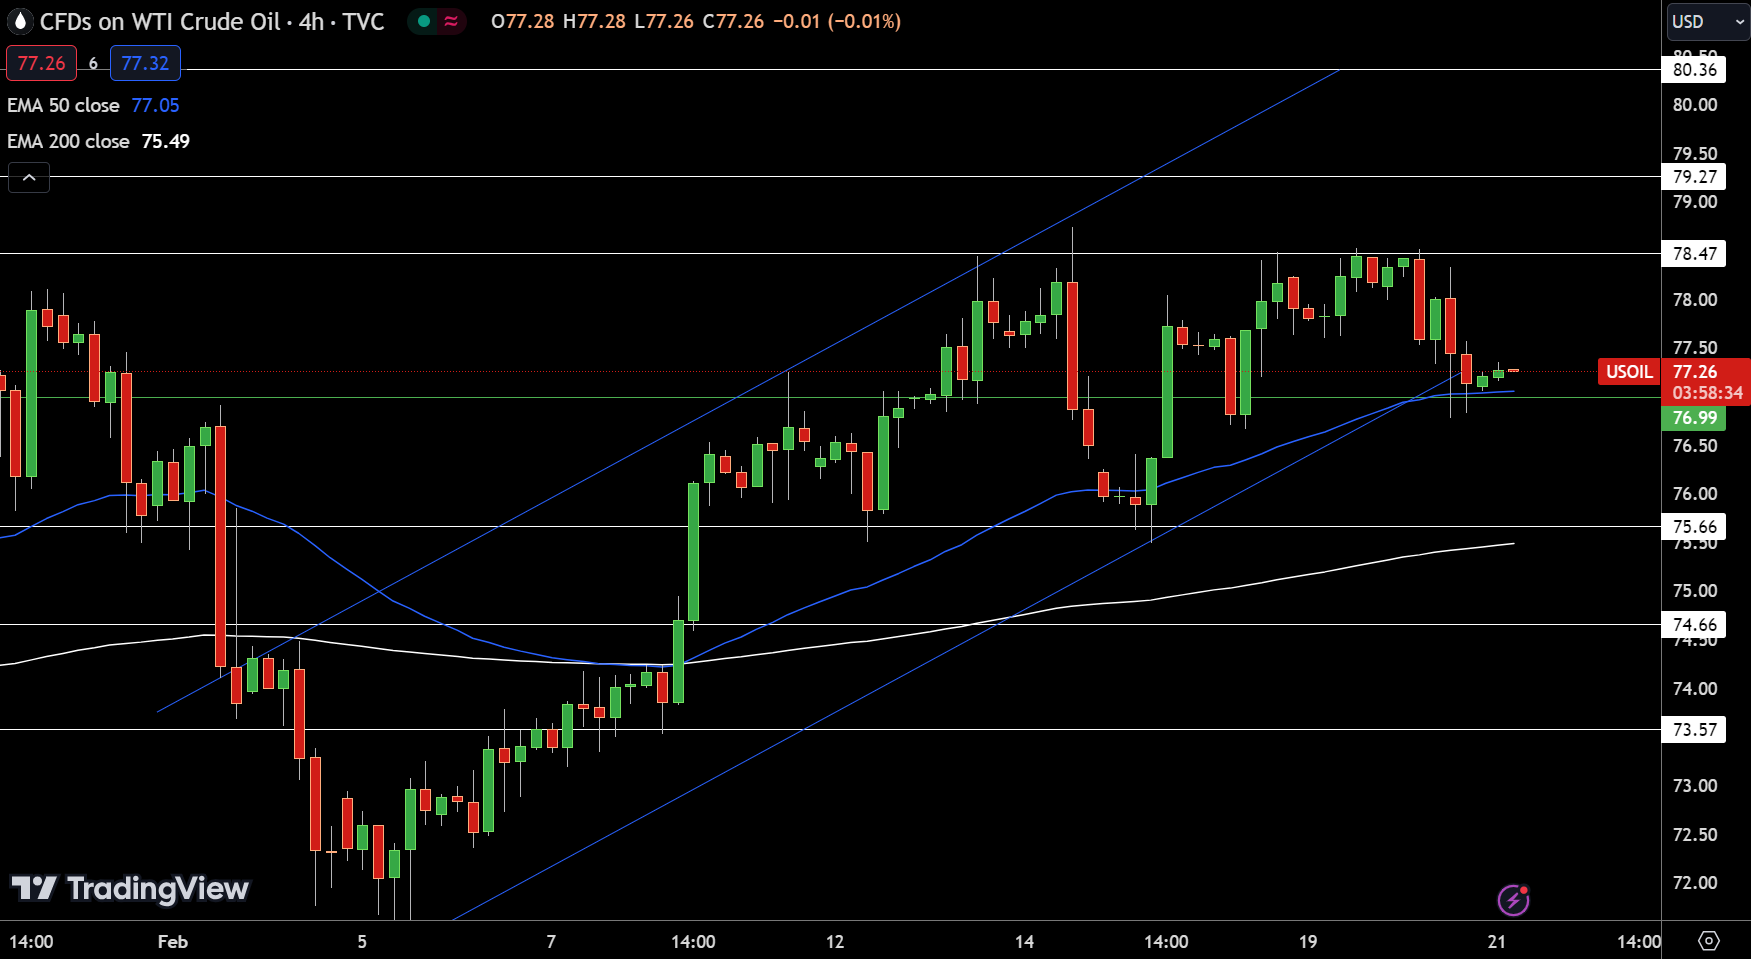
Conclusively, the trend for USOIL leans bullish provided it sustains above the $76.99 pivot, indicating a propensity for upward movement contingent on maintaining this critical support level.
Brent Oil Price Forecast
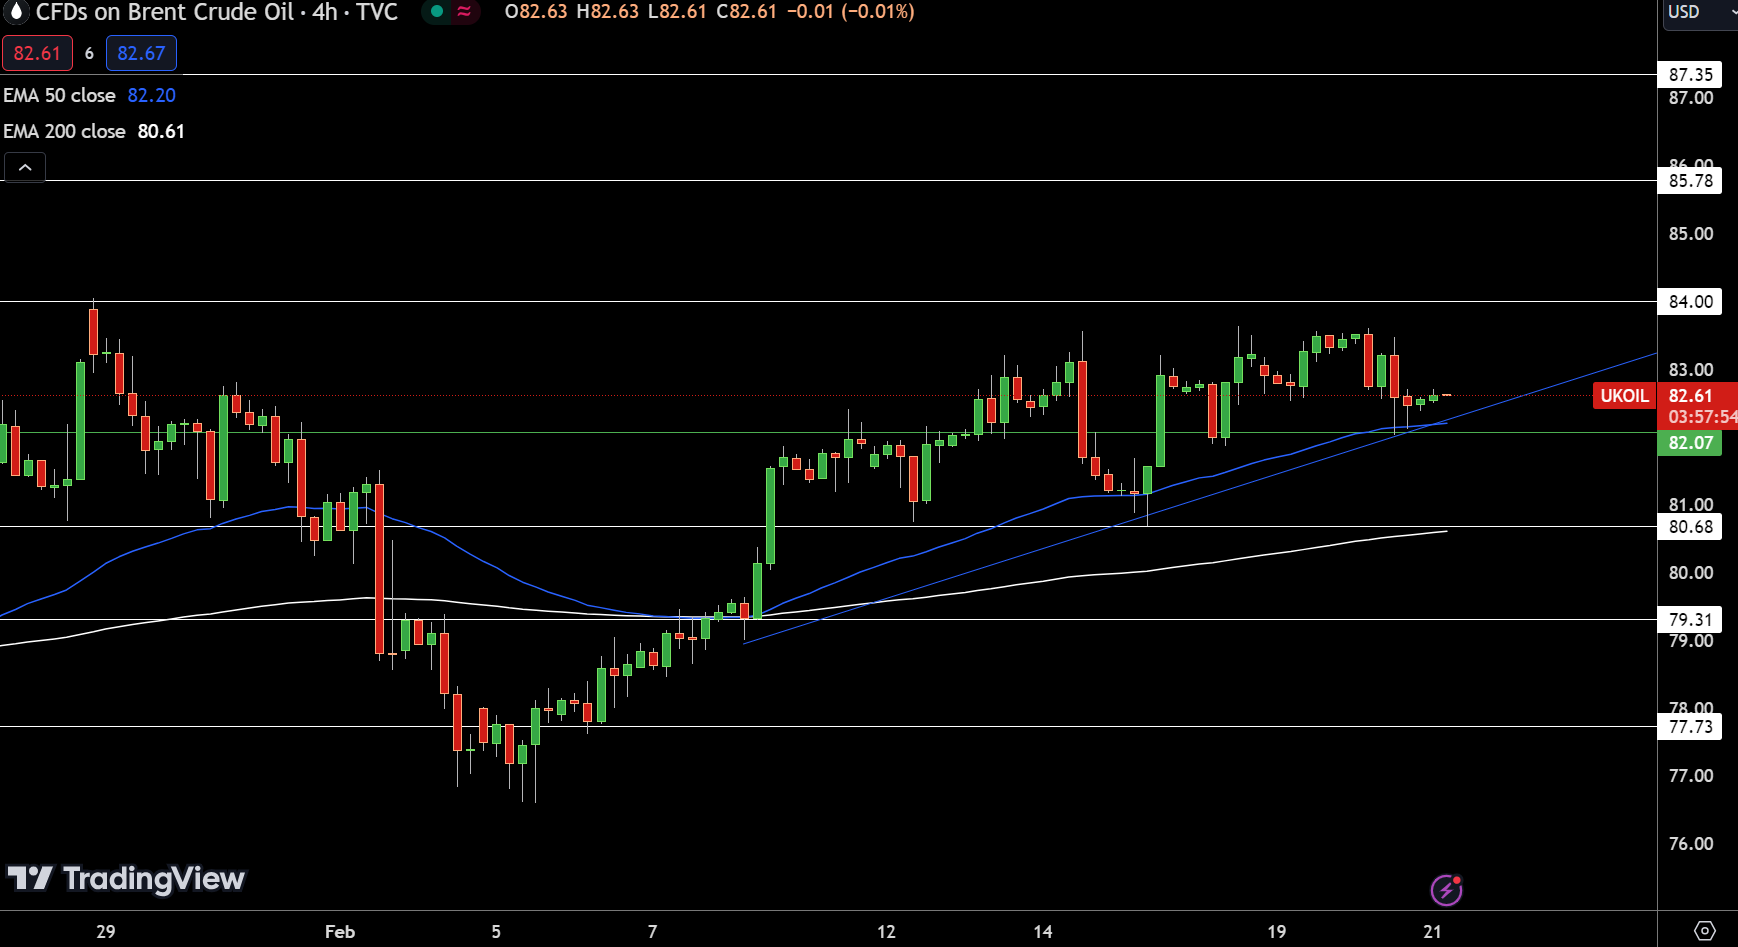
With prices above the pivot and key EMAs, the trend is bullish, suggesting sustained upward movement if the pivot level holds, highlighting the market’s current strength and potential direction.
For a look at all of today’s economic events, check out our economic calendar.