



Key Insights

- U.S. oil production surge and Gulf Coast pipeline activity boost WTI prices.
- OPEC’s positive demand forecast for 2024-2025 supports Oil market stability.
- Red Sea disruptions and geopolitical tensions underpin oil price resilience.
Quick Fundamental Outlook
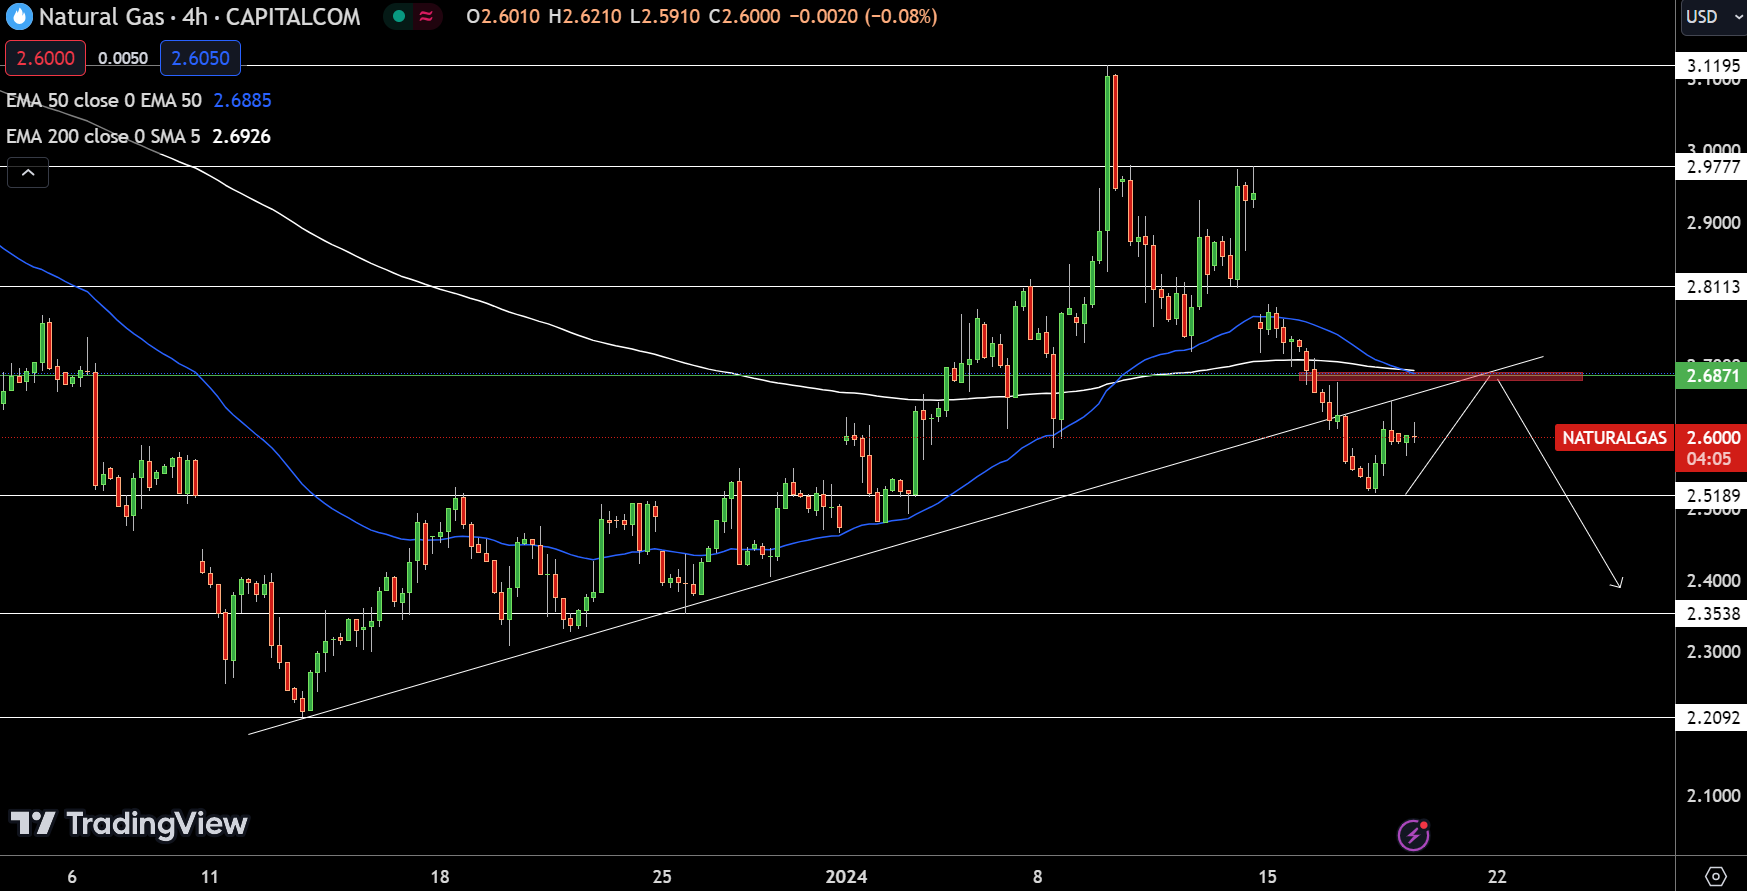
Natural Gas (NG) is currently experiencing a slight decline, down by 0.31% to $2.5875. The four-hour chart indicates a pivotal moment, with a pivot point at $2.6871. Resistance is observed at $2.8113, with further ceilings at $2.9777 and $3.1195.
Supports are closer to $2.5189, and if breached, we could see further tests at $2.3538 and $2.2092. The 50 and 200-day Exponential Moving Averages, at $2.6885 and $2.6926, respectively, have undergone a bearish crossover, suggesting potential downward pressure at these levels.
Moreover, the previously broken upward trendline is anticipated to act as resistance, reinforcing the bearish outlook. The overall trend for NG remains bearish below $2.6871, with expectations that resistance levels will be tested in the coming sessions.
WTI Oil Price Forecast
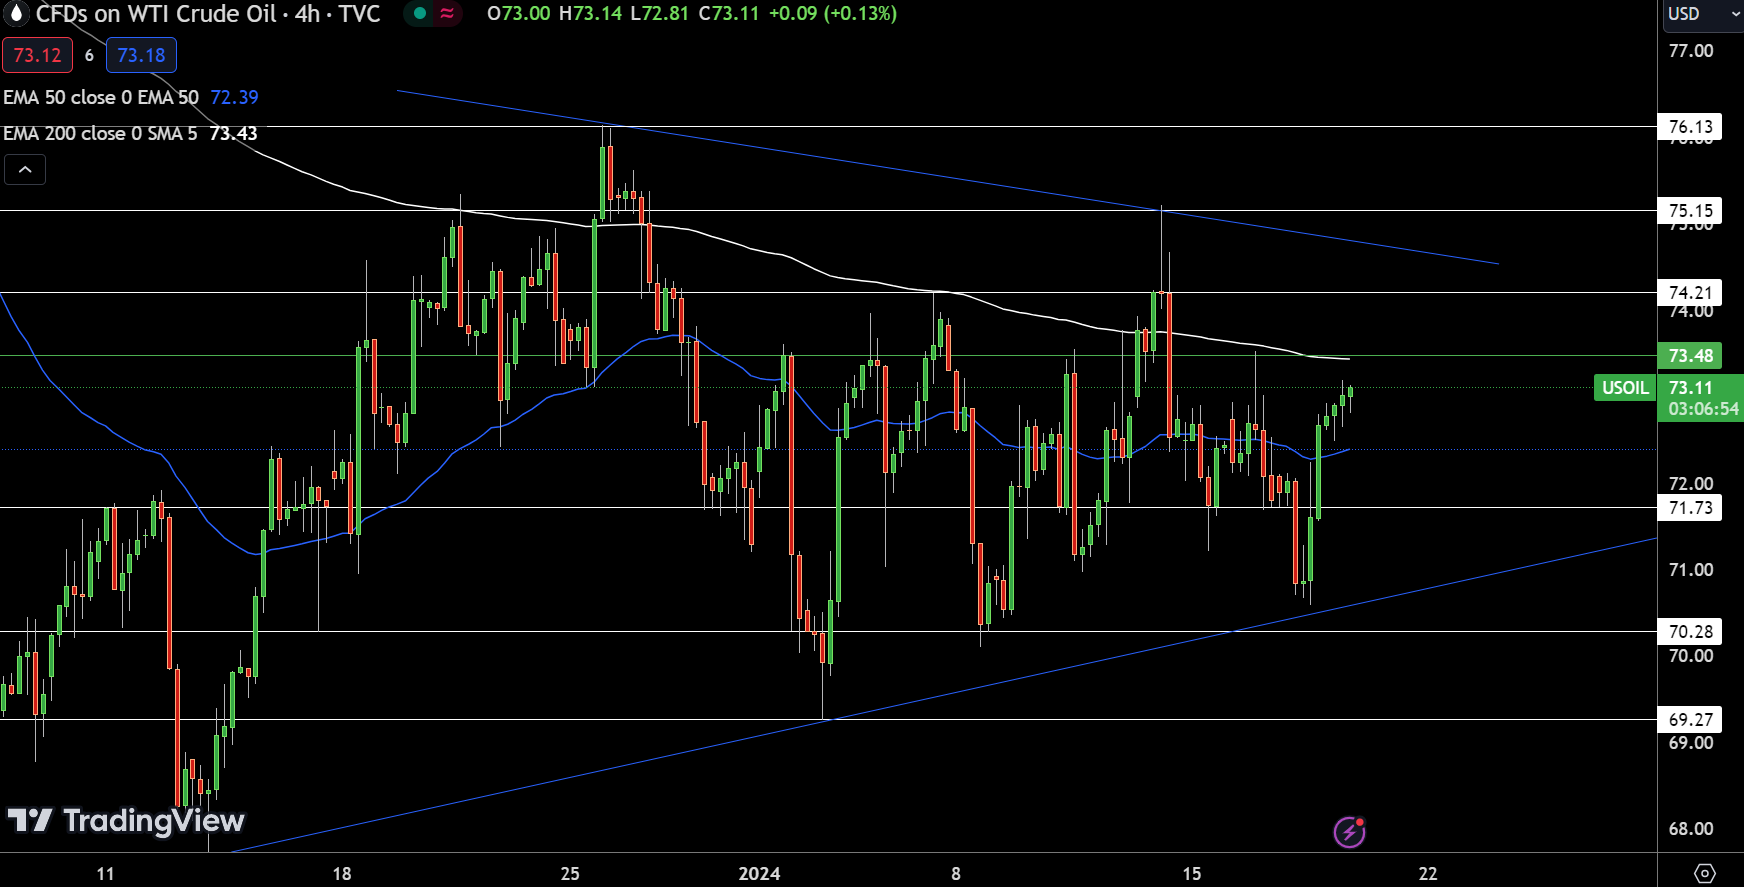
US Oil (USOIL) has ticked upwards by 0.47%, with a current price of $73.03. The four-hour chart shows a pivot point at $73.48, indicating immediate resistance levels at $74.21, $75.15, and $76.15.
On the downside, support levels are placed at $71.73, followed by $70.28 and $69.27. The 50-day Exponential Moving Average (EMA) lies at $72.39, suggesting some bullish sentiment, while the 200-day EMA is at $73.43, near the pivot point, potentially capping upward movements.
Chart patterns reveal an upward trendline that has prompted a bullish response from the $71 support level. Presently, USOIL is navigating towards the $73.48 pivot point. The proximity of the 200-day EMA to this pivot point could serve as a resistance zone, possibly restraining further ascent.
The outlook for USOIL is bearish below the $73.48 threshold, suggesting that the commodity’s next move could be pivotal.
Brent Oil Price Forecast
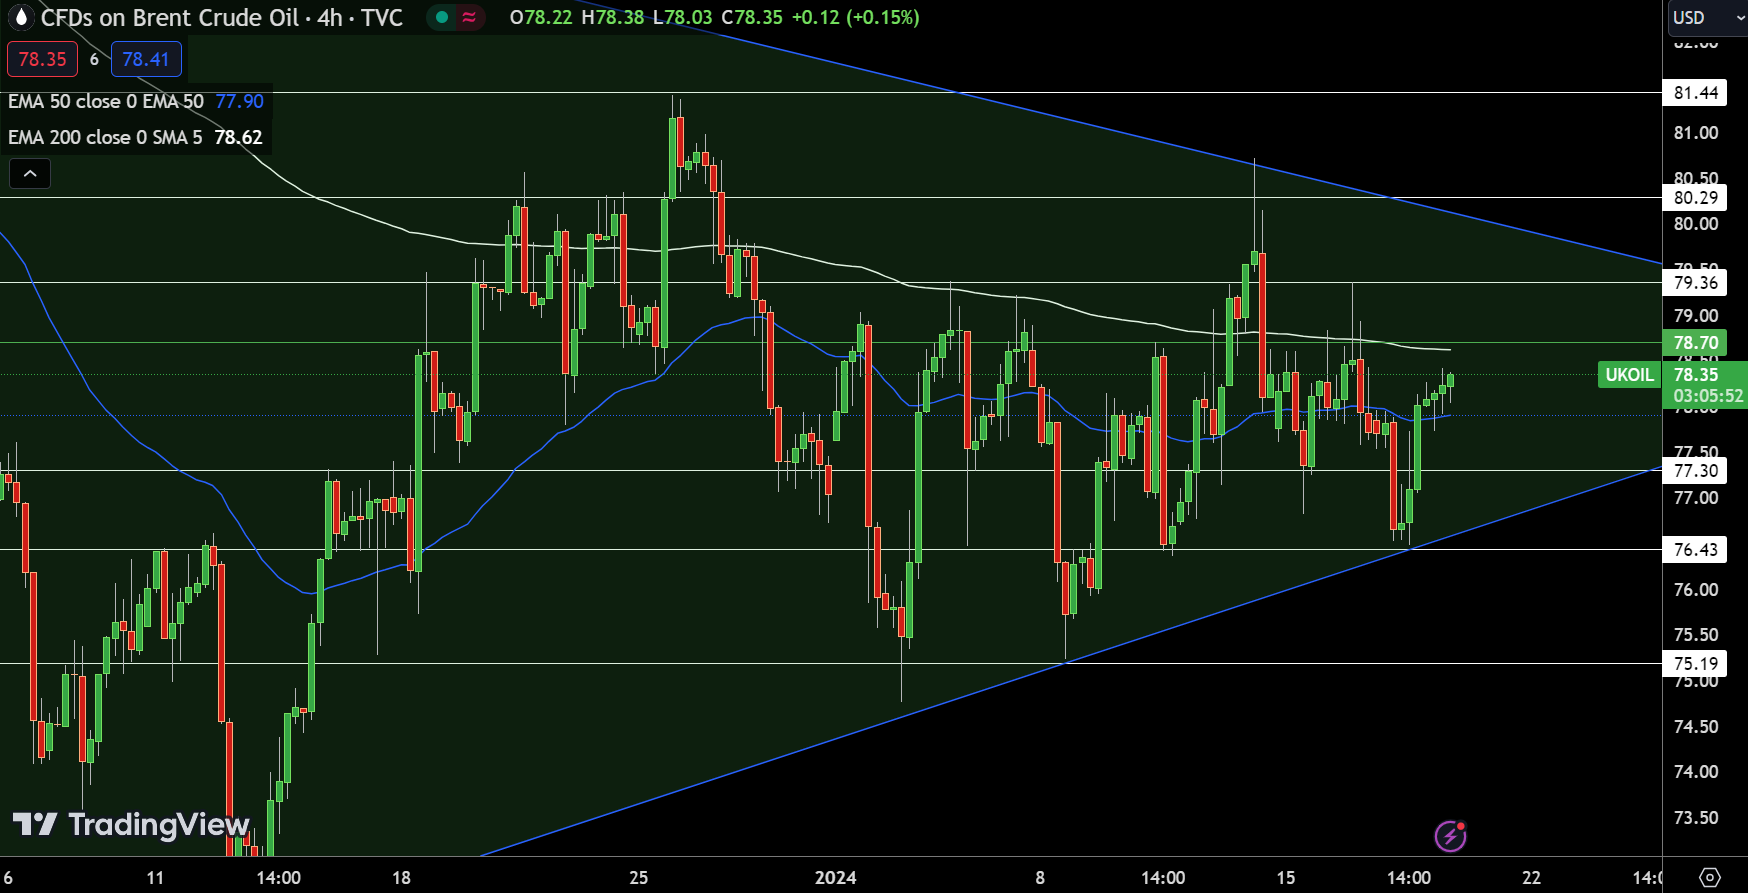
UK Oil (UKOIL) registers a modest increase of 0.36%, trading at $78.29. The 4-hour chart reveals a pivot point at $78.70, with resistance levels at $79.36, $80.29, and $81.44, while supports are positioned at $77.30, $76.43, and $75.19.
The 50-Day and 200-Day Exponential Moving Averages (EMAs) are placed at $77.90 and $78.62, respectively, close to the pivot, indicating potential resistance that could impede upward momentum.
An upward trendline initiated a bullish response near the $76.50 level, propelling UKOIL toward the pivot of $78.70. The proximity of the 200-Day EMA to the pivot suggests it could restrain further upward progress. The current trend for UKOIL is bearish below the $78.70 mark, with the commodity’s immediate direction dependent on its ability to surpass this pivot point.


