



Oil and Natural Gas Markets Remain Cautious as Ceasefire Holds
On May 28, 2026, crude oil markets were relatively calm after the U.S.-Iran conditional ceasefire, now more than eight weeks old, continued and the flow of tankers through the Strait of Hormuz began to gradually resume. The agreement has largely removed the acute geopolitical uncertainty that was responsible for a volatile period in March and early April and market participants can now turn their attention towards other more conventional factors.
The markets are now reflecting a more balanced oil scenario. U.S. production, OPEC+ output and repairs in some areas in the Gulf are all working to support the market and restore some supply, however complete normalization has yet to happen. Some increase in Asian demand has been seen following the initial spike in oil prices but consumption in the emerging world has been slower to pick up again.
The natural gas market remains muted, buoyed by a healthy storage build and milder spring weather patterns in the U.S. and Europe, the peace deal also removes some pressure on gas flows from the Middle East and spot markets are weaker in Asia and Europe.
Investors are still closely monitoring the upcoming EIA inventory data and the next OPEC+ meeting. While the truce has calmed oil prices, the deal is still fragile. If that deal falls apart, market participants will once again turn their attentions to possible supply disruptions.
Natural Gas (NG) Futures Price: $3.00 is the Target as The Blue Channel Breaks Above
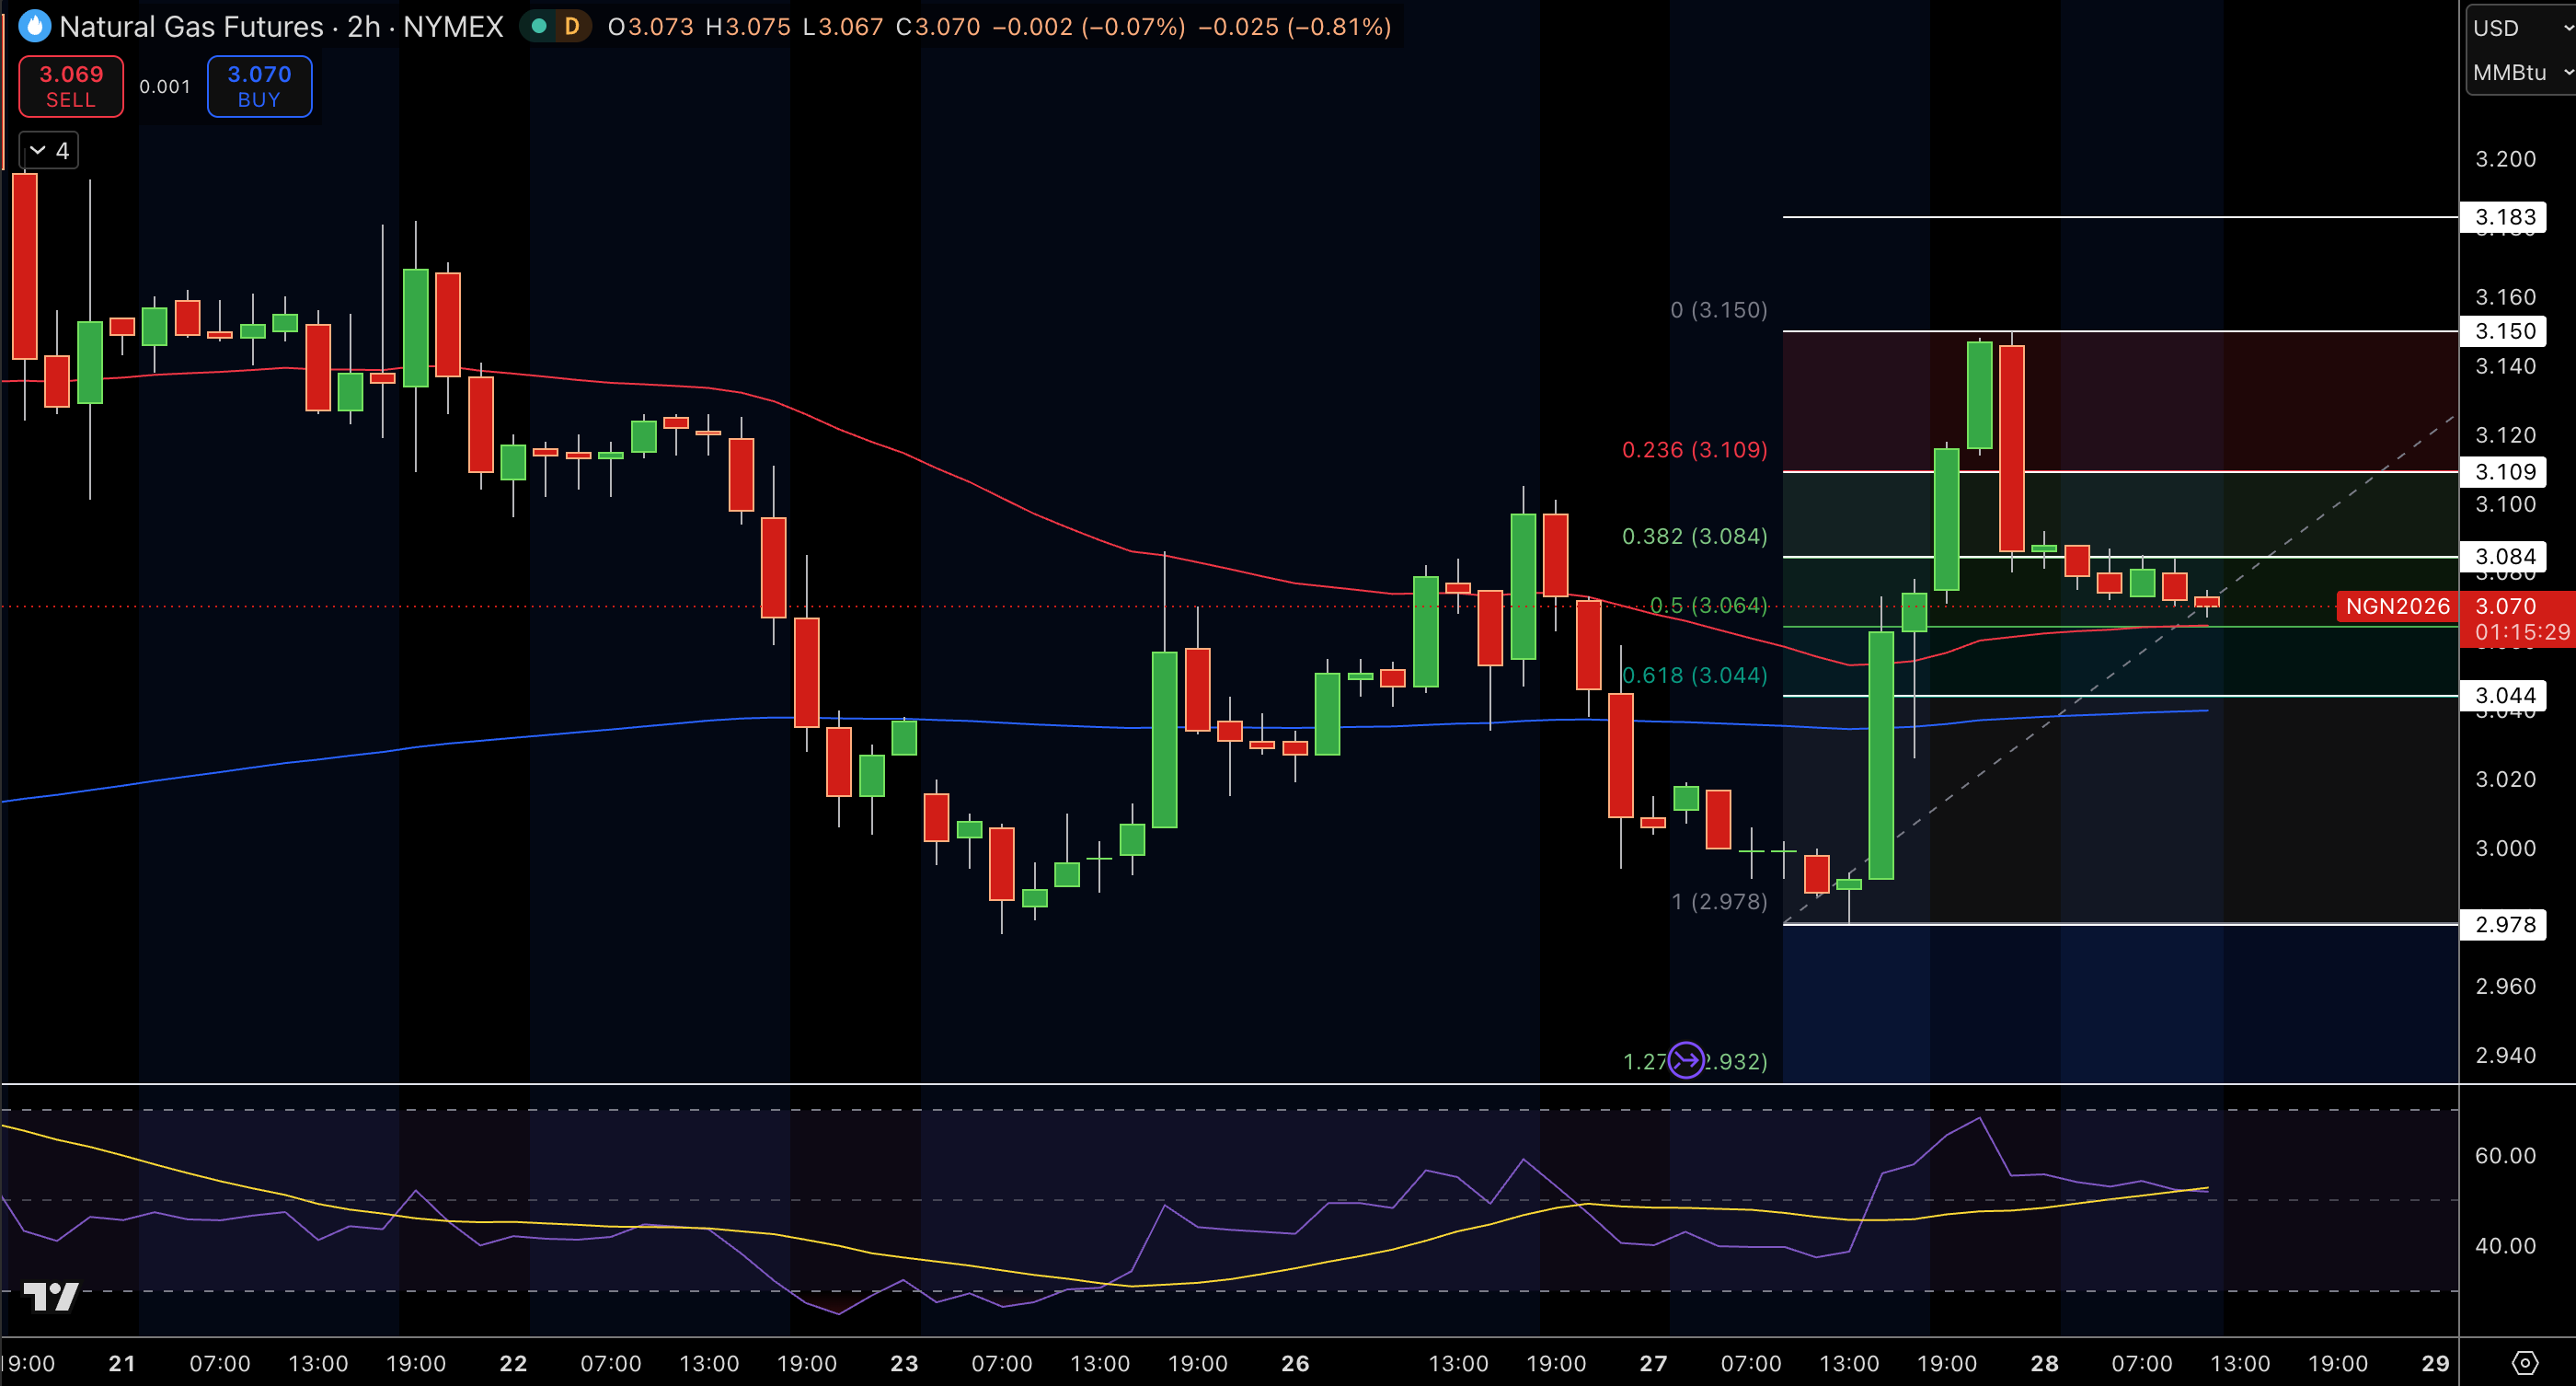
At $2.995 on the 2h (NYMEX), the Natural Gas futures contract continues rallying after green candles took out the red 50-period moving average near $2.95 and broke out to the upside of a prior swing high. Continuing bull market structure is respecting the white trend line with higher lows (price has broken to the upside above the prior swing high in the blue ascending channel area) and positive momentum is forming from the green candles.
The RSI is now above 55 indicating positive momentum. The next Fibonacci extension area of resistance is near $3.008 to $3.066 with price continuing above the white trend line. There is more upside potential for price as market structure continues higher from $2.80 as price is now trading in a clean ascending channel from the lower lows in May.
Trade Idea: Buy $2.995 targeting $3.008, stop $2.82.
Natural Gas Price Forecast
Every new Natural Gas analysis as it publishes, today's technical signal and key levels, live price — on one page.
See all Natural Gas forecastsWTI Crude Oil Breaks $92 – Blue Channel Breakdown Accelerates
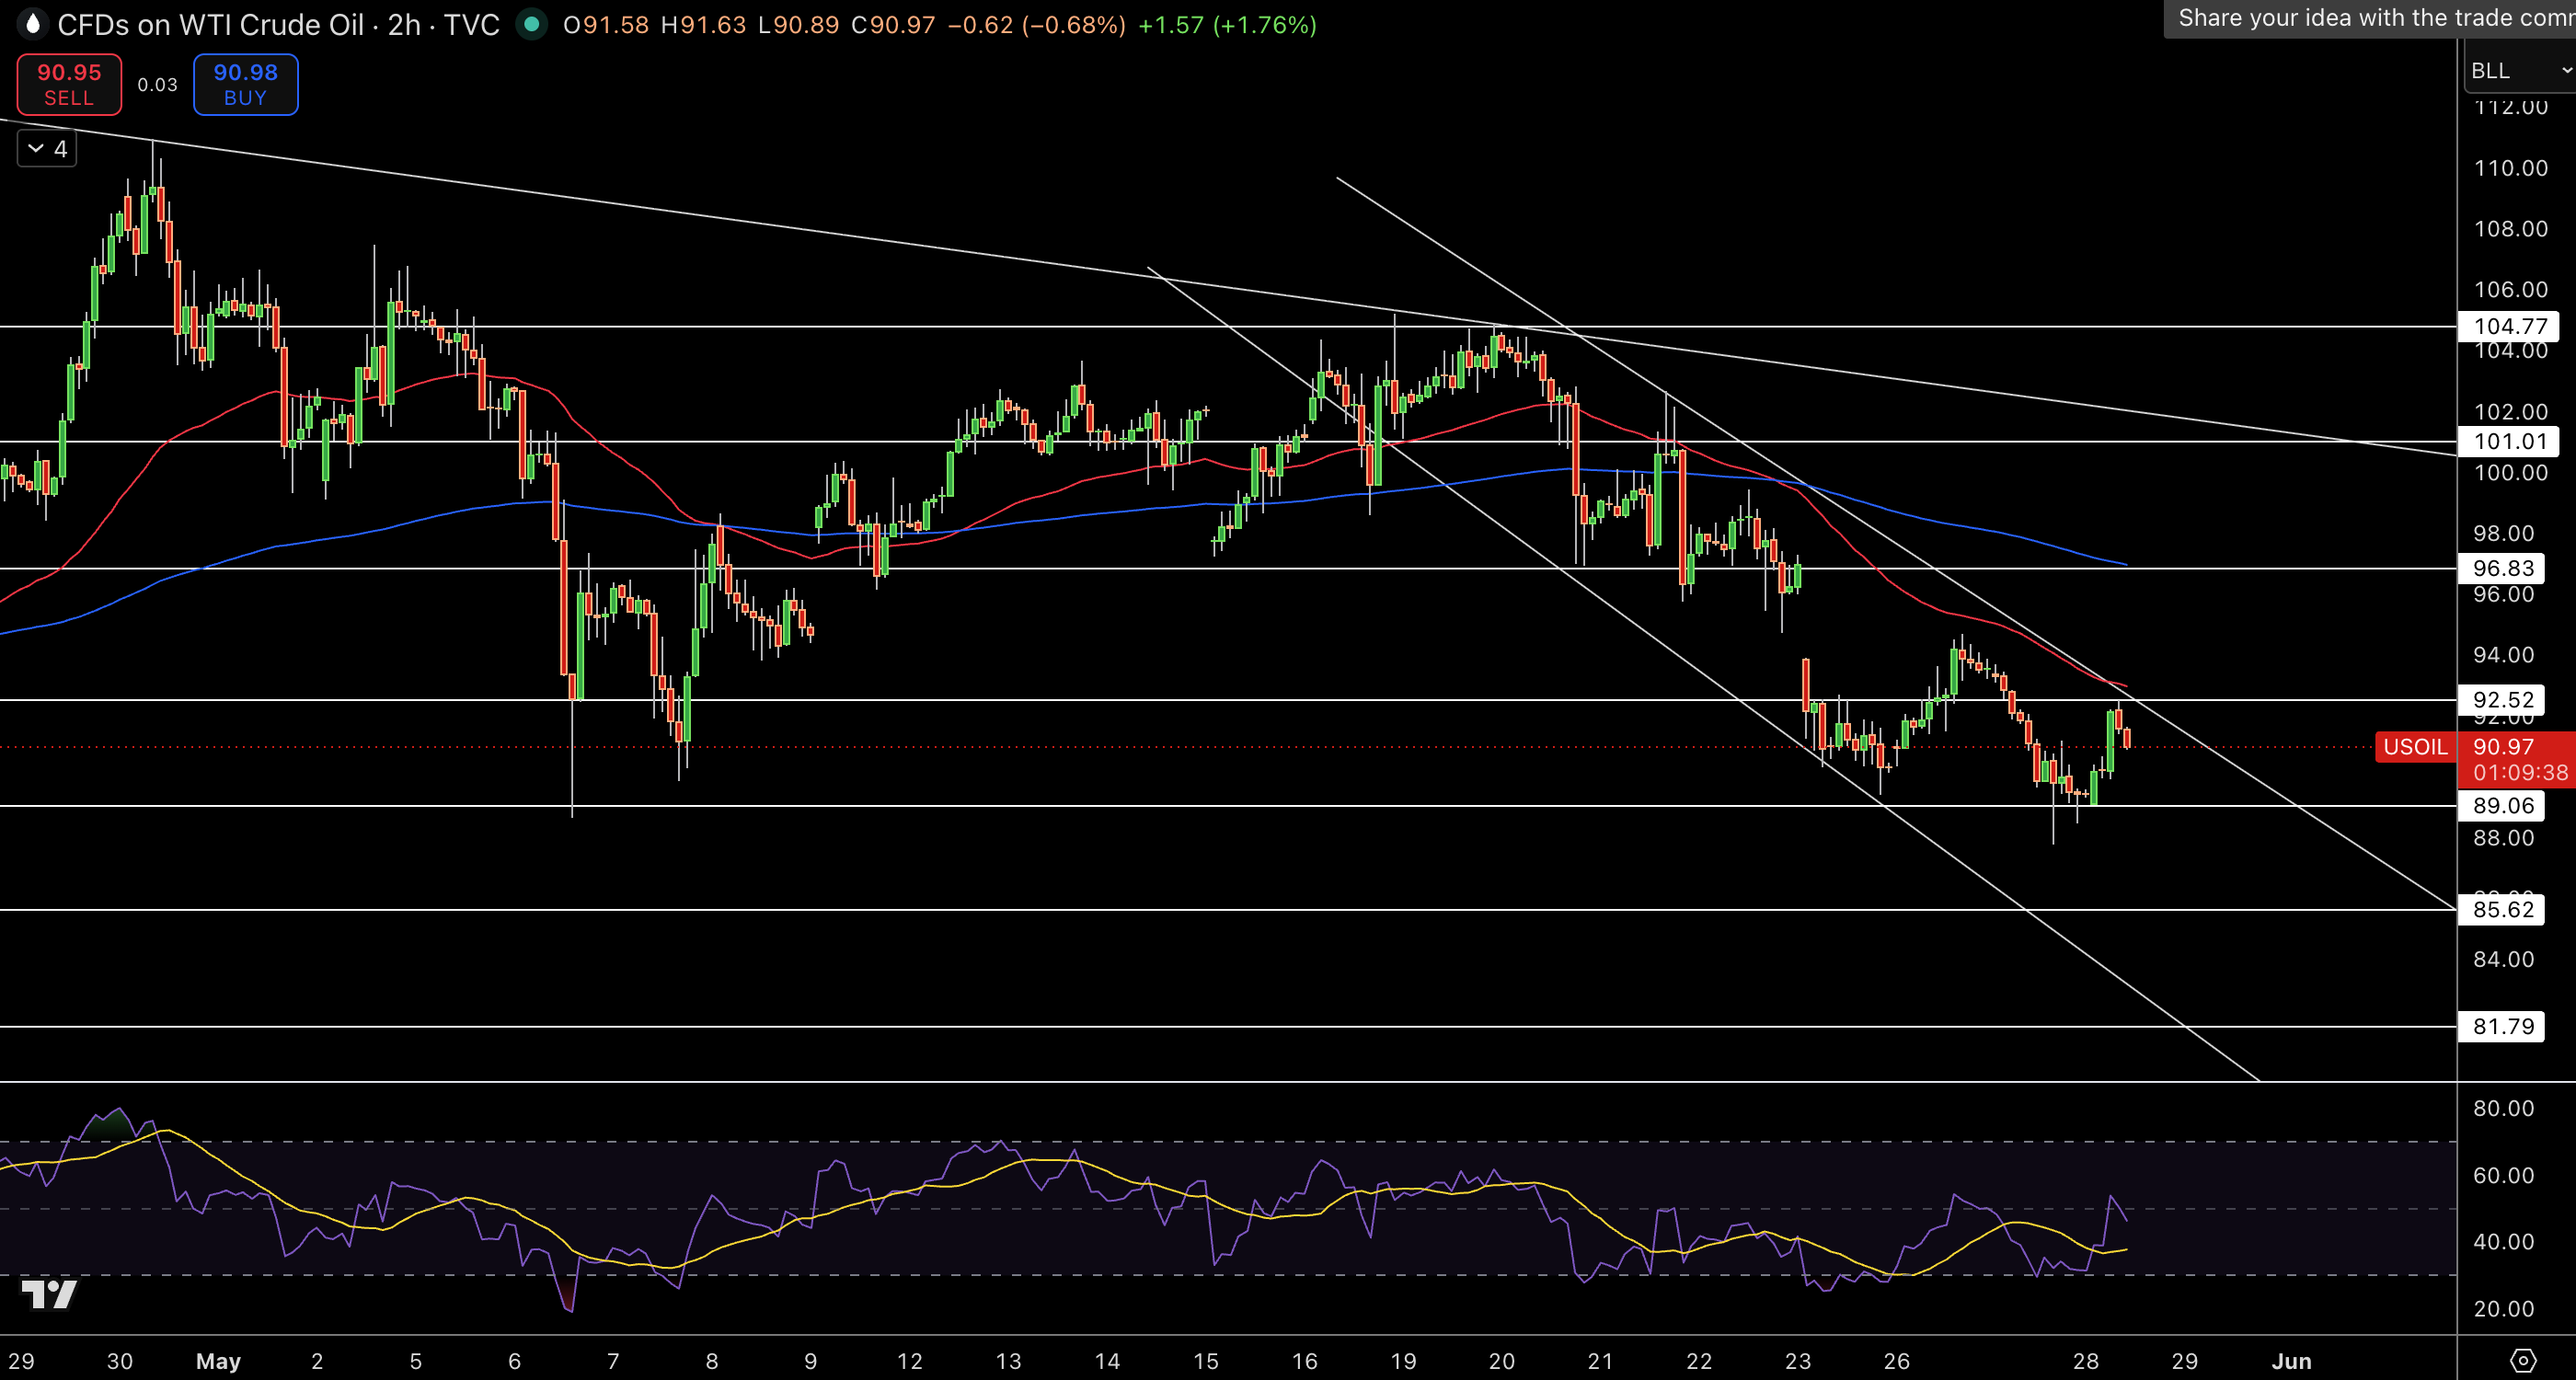
At $91.99 on the 2h, the WTI Crude Oil futures contract continues selling-off after red engulfing candles broke below the blue ascending channel floor area near $96.05, the red 50-period moving average at $98.14 and all the Fibonacci supports. A continuation of bearish market structure from the $102.77 high with lower lows and selling pressure (large distribution wicks). Price could test the next area of the Fibonacci extension near $89.96 to $88.55.
The RSI is now below 40 after losing momentum. Volume is showing poor trading price from $100.00 to $102.00 and is fair value. Price could not hold above the white descending trendline near $97.20 formed in May. Bearish structure in place below $96.05 with price in an extended down channel (forming since May highs).
Trade Idea: Sell $91.99 targeting $89.96, stop $93.00.
Brent Crude Oil Down $95.01, Up Blue Channel Bottom Tested
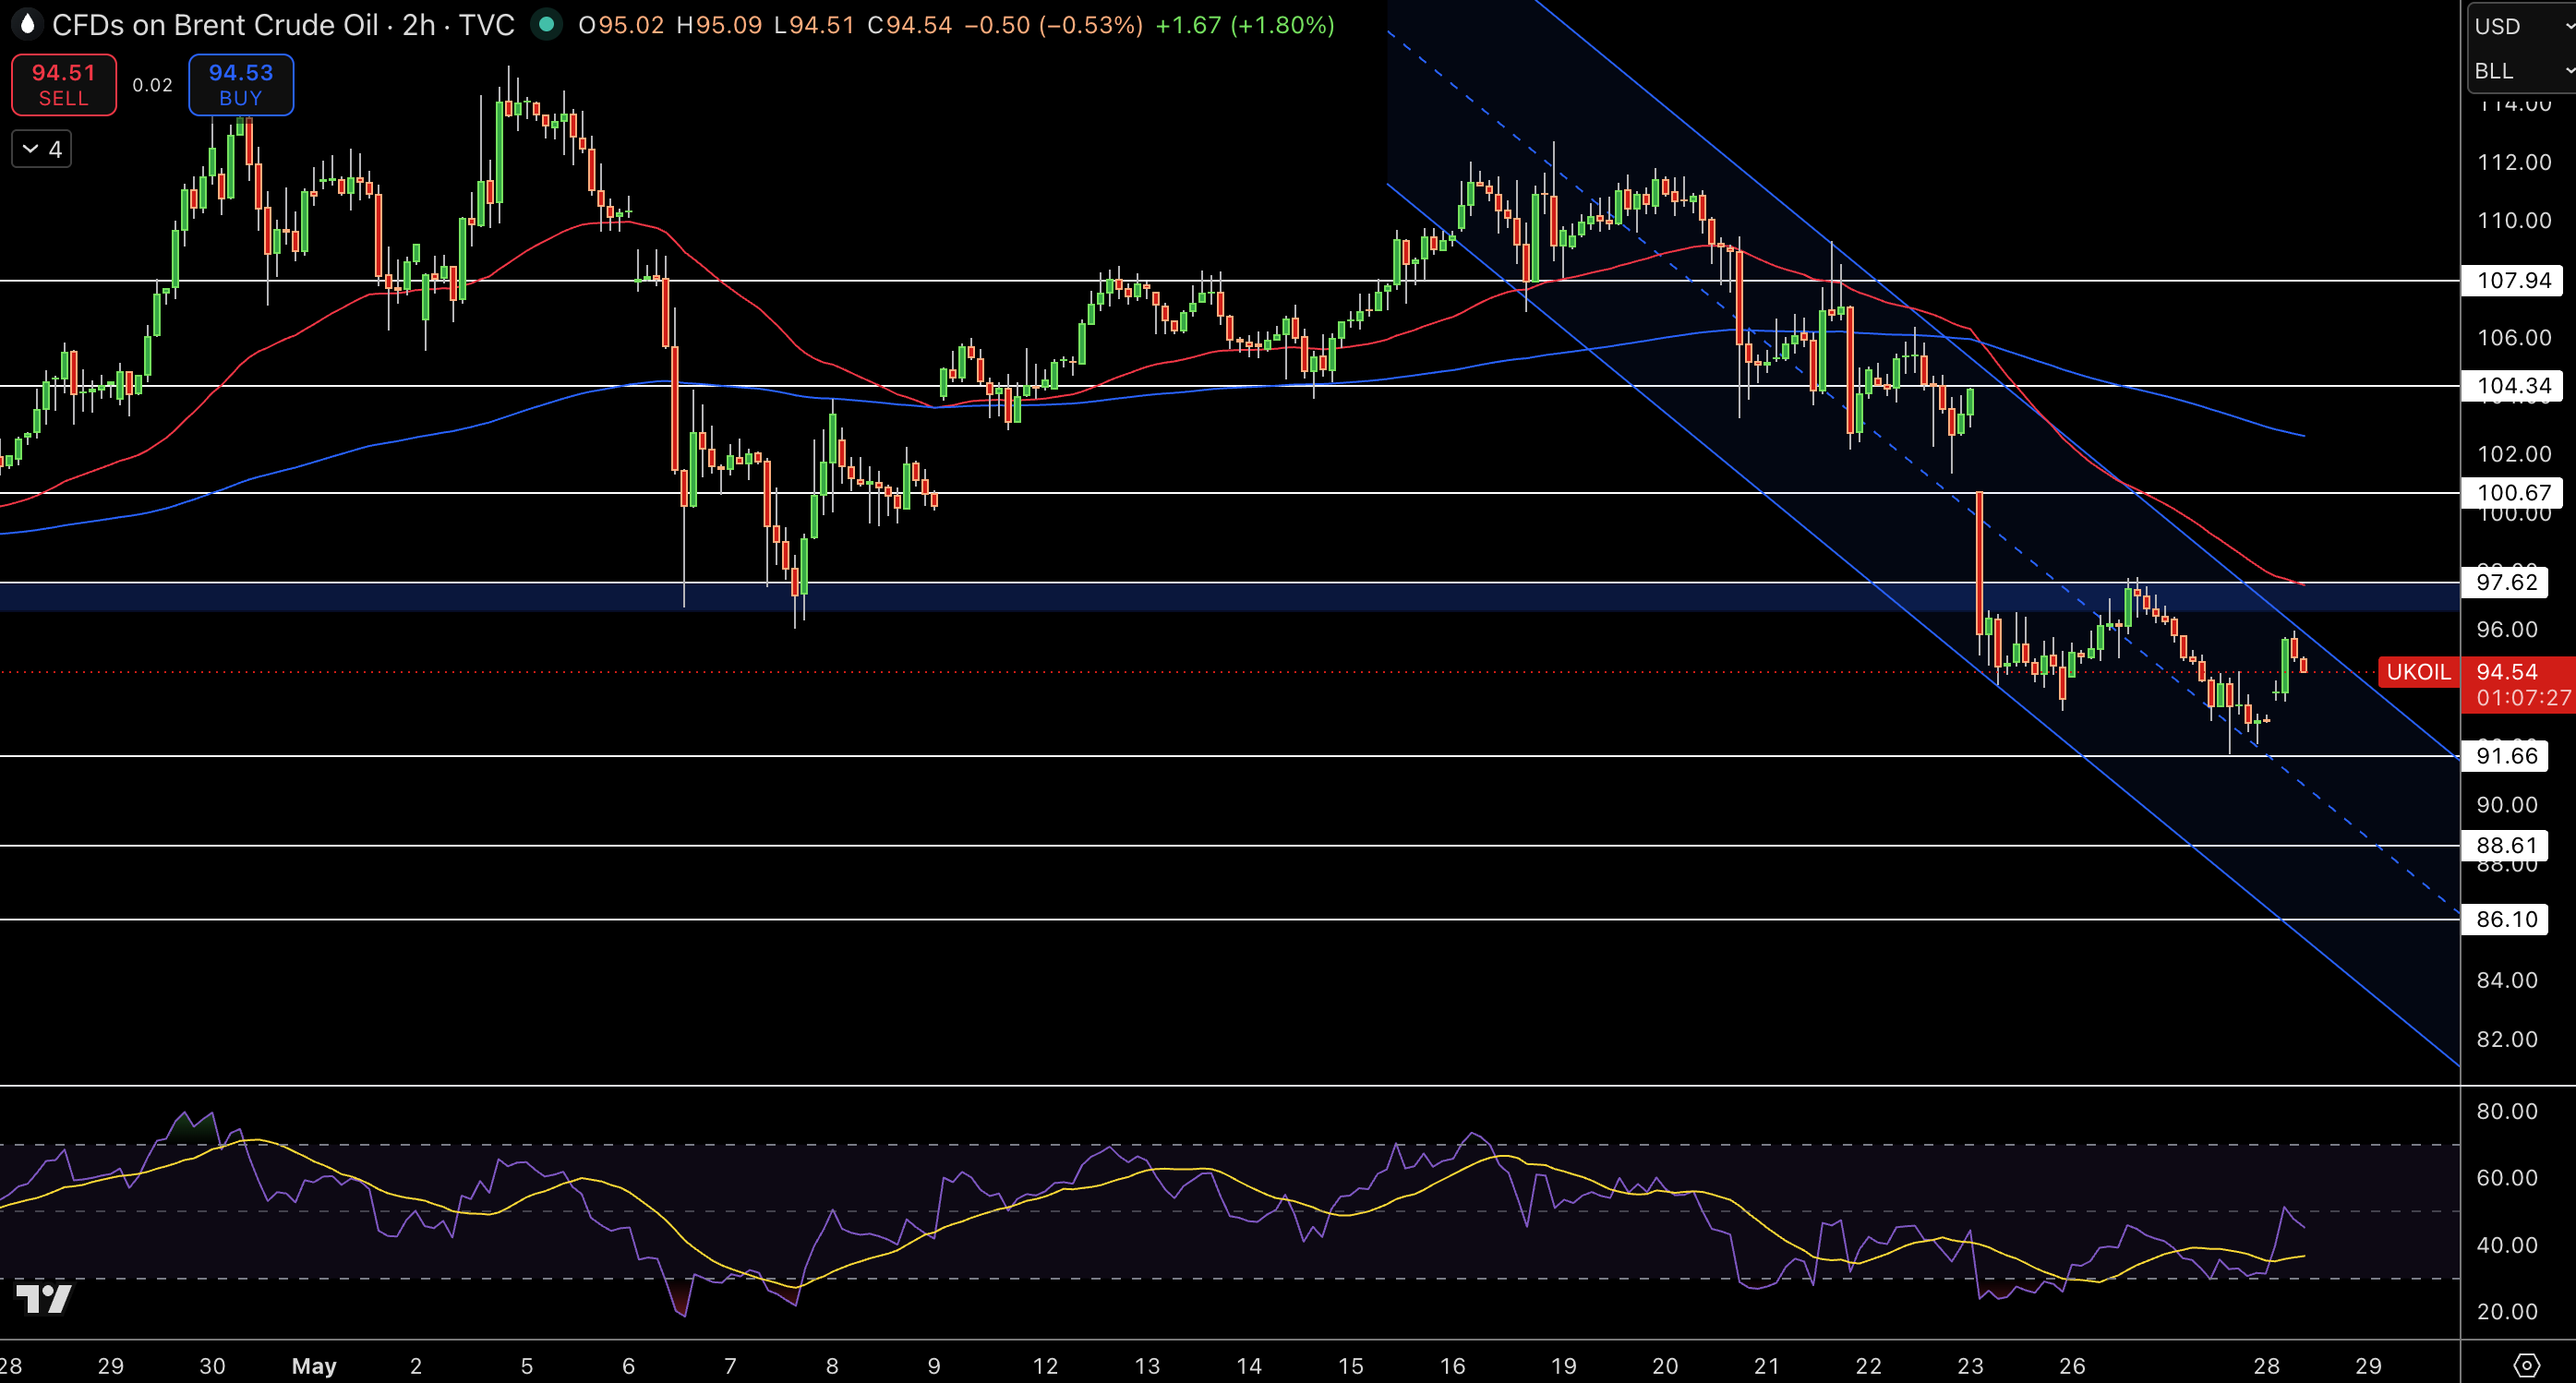
Brent Crude was trading at $95.01, the 2h chart shows red candles on the 2h and has tested the blue up channel line below and the red MA and price action near $103.10. The lower highs continue and are still lower from the recent $94 low high, however the higher lows will hold for now. RSI is hovering near 45 as a neutral to negative momentum reading.
Next Fib support is in the low $94.75. Volume profiles in the $108 to 109 will serve as the heavy supply. Structure is neutral to negative for all time frames below the 103. And the 2h price action is holding the bottom of the blue up channel from April.
Trade Idea: $95.01 Short Target $94.00, Stop $97.54