



Upcoming Federal Reserve minutes and the OPEC+ meeting on June 1 add to market caution.
Natural Gas Price Forecast
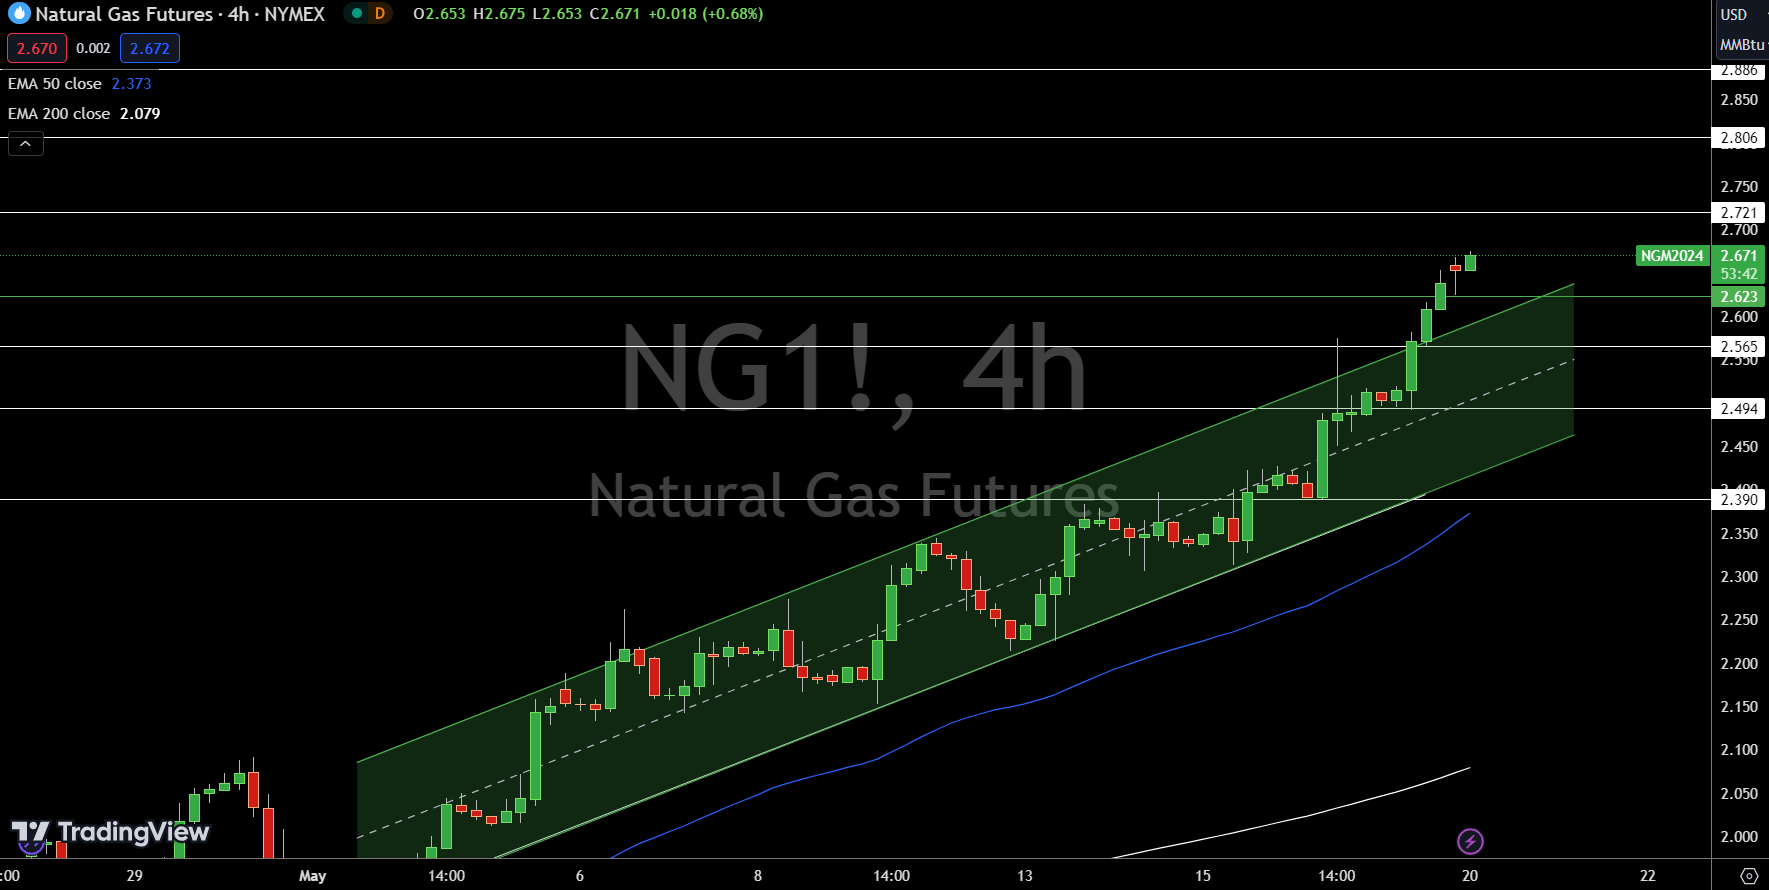
Natural Gas (NG) is currently trading at $2.671, up 1.49%. The 4-hour chart highlights the pivot point at $2.62, a critical level for near-term price action. Immediate resistance is identified at $2.72, followed by $2.81 and $2.89. On the downside, immediate support lies at $2.57, with further support at $2.49 and $2.39.
The 50-day Exponential Moving Average (EMA) is positioned at $2.37, and the 200-day EMA stands at $2.08, indicating a bullish trend. The alignment of the 50 EMA above the 200 EMA supports continued upward momentum. Holding above the $2.62 pivot point reinforces the bullish outlook, while a break below this level could trigger a sharp selling trend.
WTI Oil Price Forecast
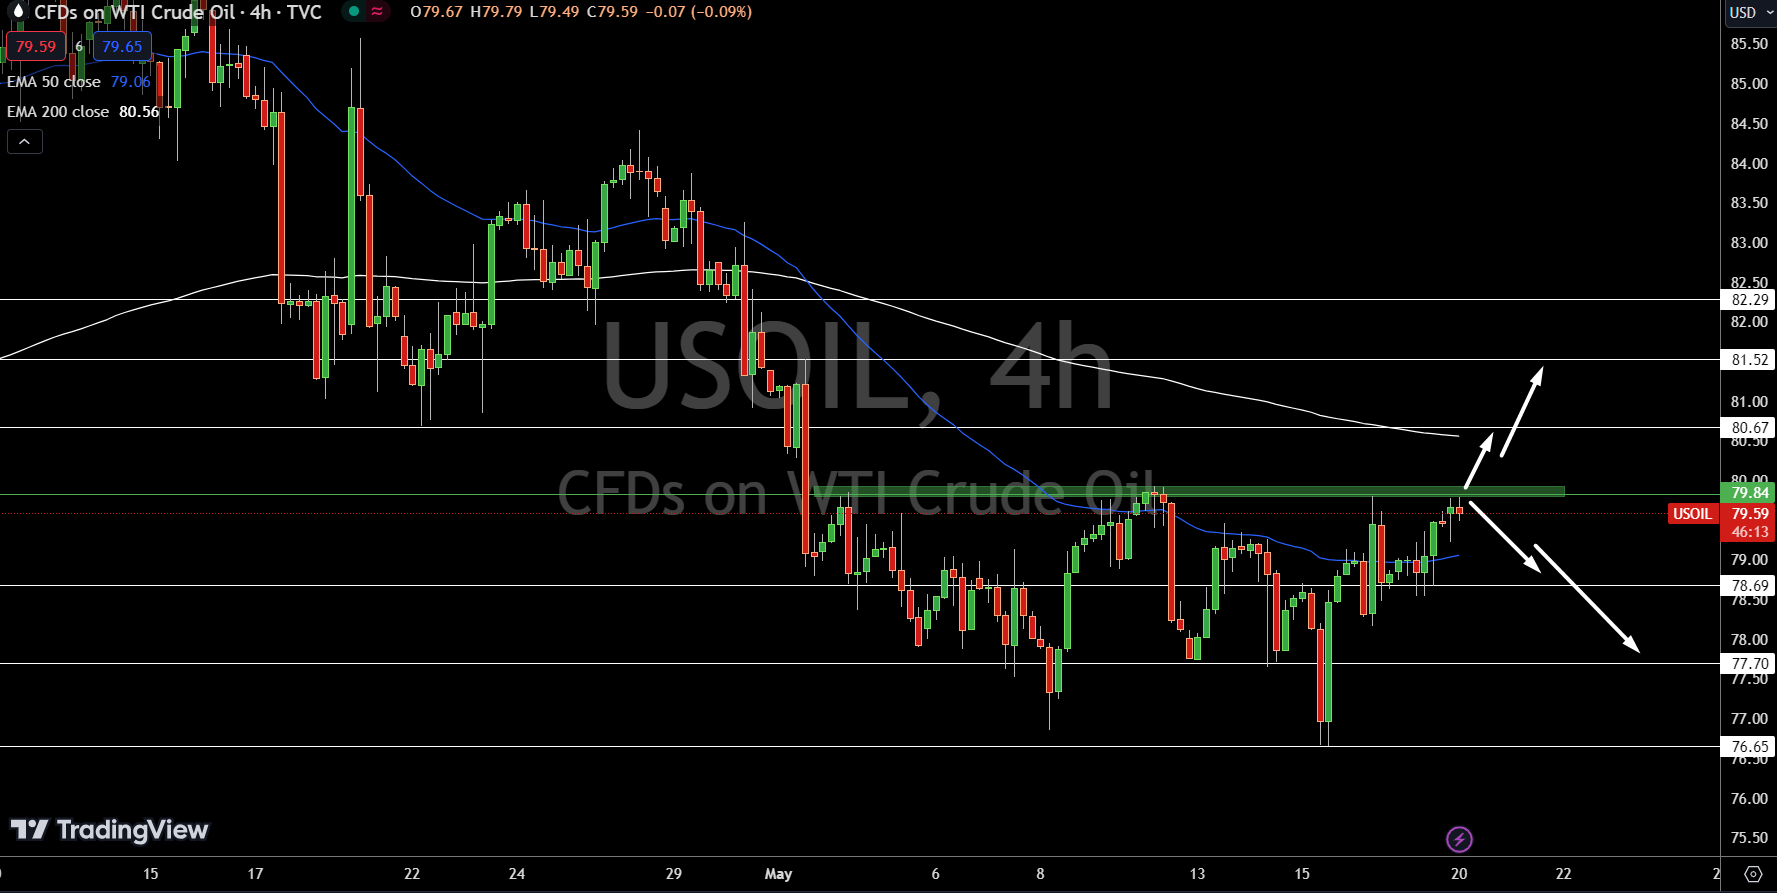
USOIL is currently trading at $79.59, down 0.15%. The 4-hour chart highlights the pivot point at $79.84, a critical level for near-term price action. Immediate resistance is at $80.67, followed by $81.52 and $82.29. On the downside, immediate support is found at $78.69, with further support levels at $77.70 and $76.65.
The 50-day Exponential Moving Average (EMA) is positioned at $79.06, while the 200-day EMA stands at $80.56. A triple top pattern is extending resistance at the $79.84 pivot point, indicating a significant hurdle for upward movement.
Brent Oil Price Forecast
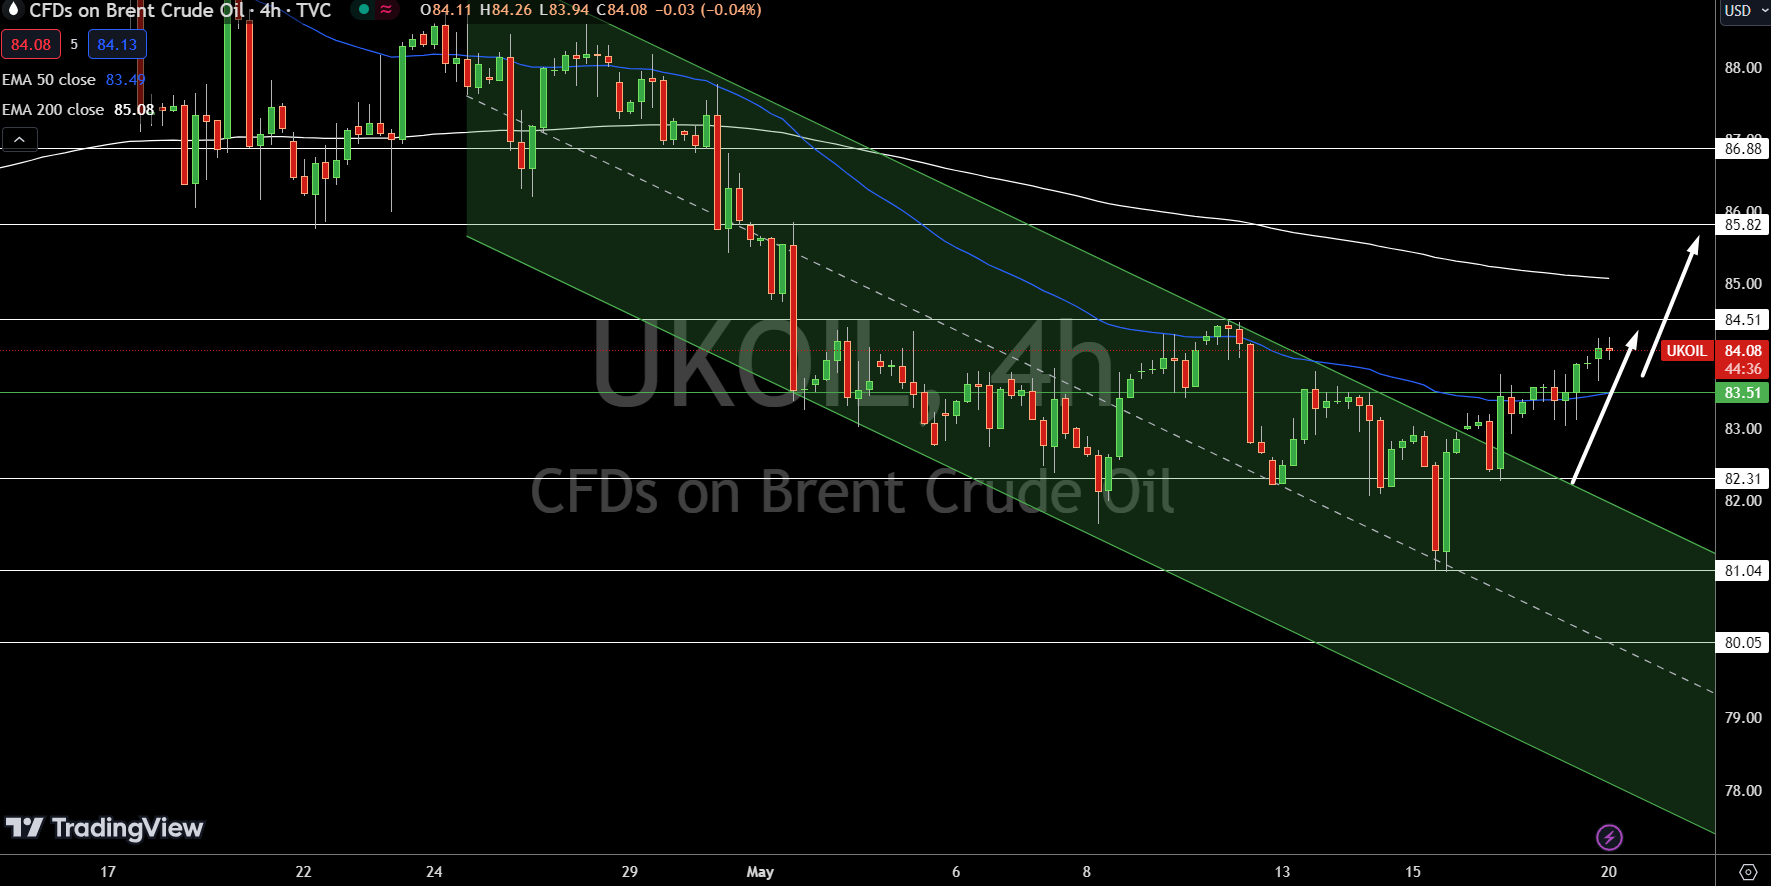
The 50-day Exponential Moving Average (EMA) is positioned at $83.49, closely aligning with the pivot point, while the 200-day EMA stands at $85.08. The alignment of the 50 EMA near the pivot point suggests a strong support level, reinforcing the bullish outlook as long as prices remain above $83.50.
For a look at all of today’s economic events, check out our economic calendar.