A Major Support Zone Emerges
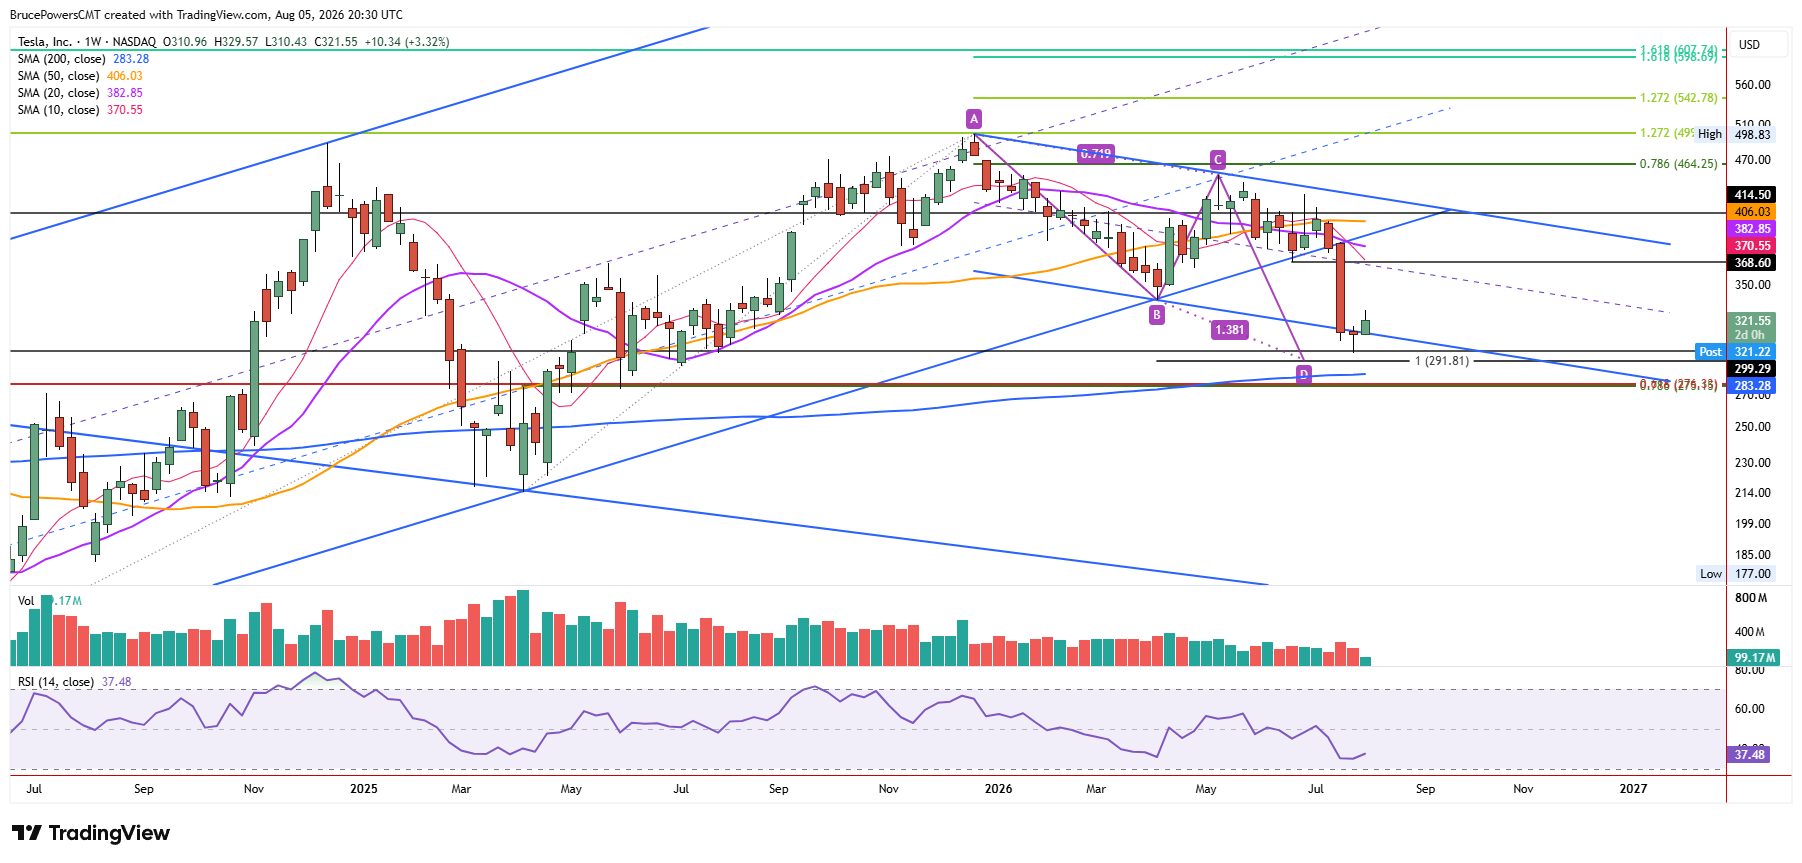
Tesla, Inc. (TSLA) reached an area of strong support recently, which may lead to the completion of the bearish correction that followed the $498.83 peak in December. A low of $297.38 was reached last week, putting the stock 40.4% below that peak. Support was found near the confluence of several downside targets that included the July 2023 peak of $299.29, a 100% projected target for a falling ABCD pattern, and the lower boundary of a falling trend channel that encompasses the structure of the bearish correction.

Weekly Signals Point Higher
So, TSLA is in an area of support that could lead to continued signs of strength and an advance toward top of the declining channel. A weekly bullish reversal signal triggered this week above last week’s high of $317.00, which happened to end with a bullish hammer candlestick pattern, providing an additional sign of strength for the weekly breakout. Moreover, the higher weekly low of $310.43 shows little pullback into last week’s range. That is another sign of strength.
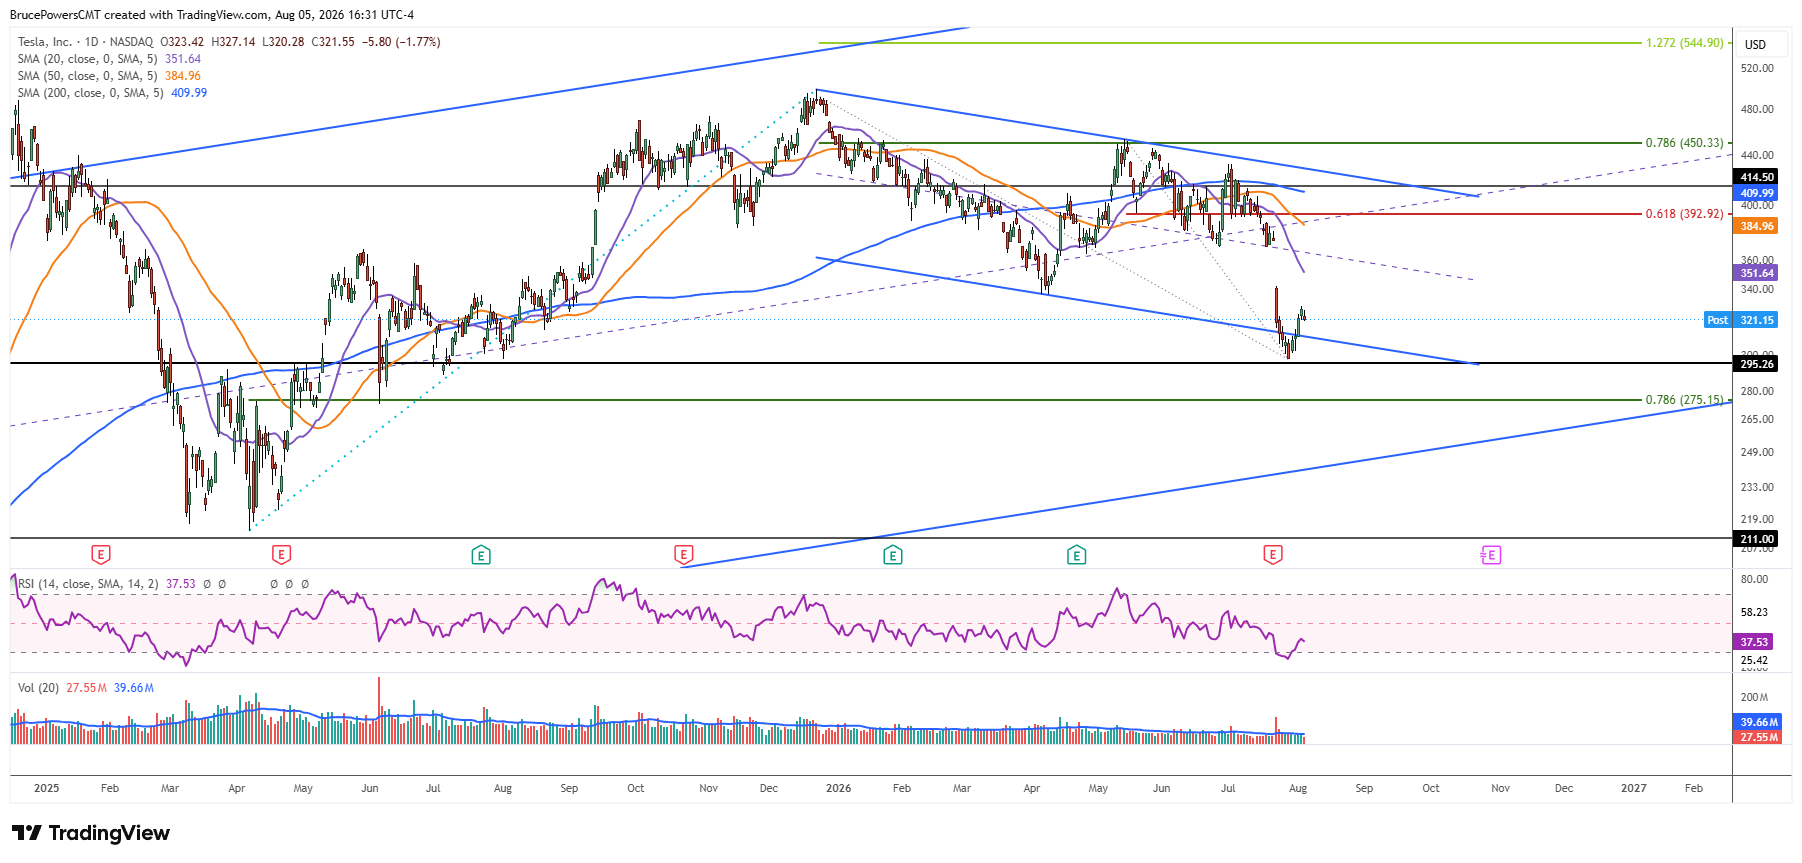
The weekly breakout will confirm on that timeframe if this week ends above last week’s high. Given the bullish position of this week’s higher low, it looks like there is a good chance that may happen. This week’s low also identifies significant short-term support, since a drop below it would not support the thesis that TSLA is getting ready to rally.
Resistance Awaits the Rebound
Initial upside targets, if buyers continue to drive price higher, start with a prior interim swing low at $368.60, followed by the three-week high of $386.61, which is near the 20-day moving average near $382.85. That level marked the prior breakdown level where bearish momentum kicked in.
A Pullback Could Offer an Entry
This analysis suggests that a pullback may be used by investors to participate in the potential bullish move. Although there has been a bullish signal on the larger timeframe weekly chart, new bullish signals will be needed to confirm that buyers remain in control.
If you’d like to know more about technical analysis and how traders use it, please visit our educational area.