Bearish Flag Breaks Lower
Natural gas consolidated in a relatively narrow range on Wednesday, as it further tested support near Tuesday’s low of $2.66. A bearish trend continuation signal occurred on Tuesday, with a breakdown from a small bearish flag pattern. The move out of the pattern was decisive and reflected strong bearish momentum, as a wide range day completed with a close in the lower third of the day’s range.
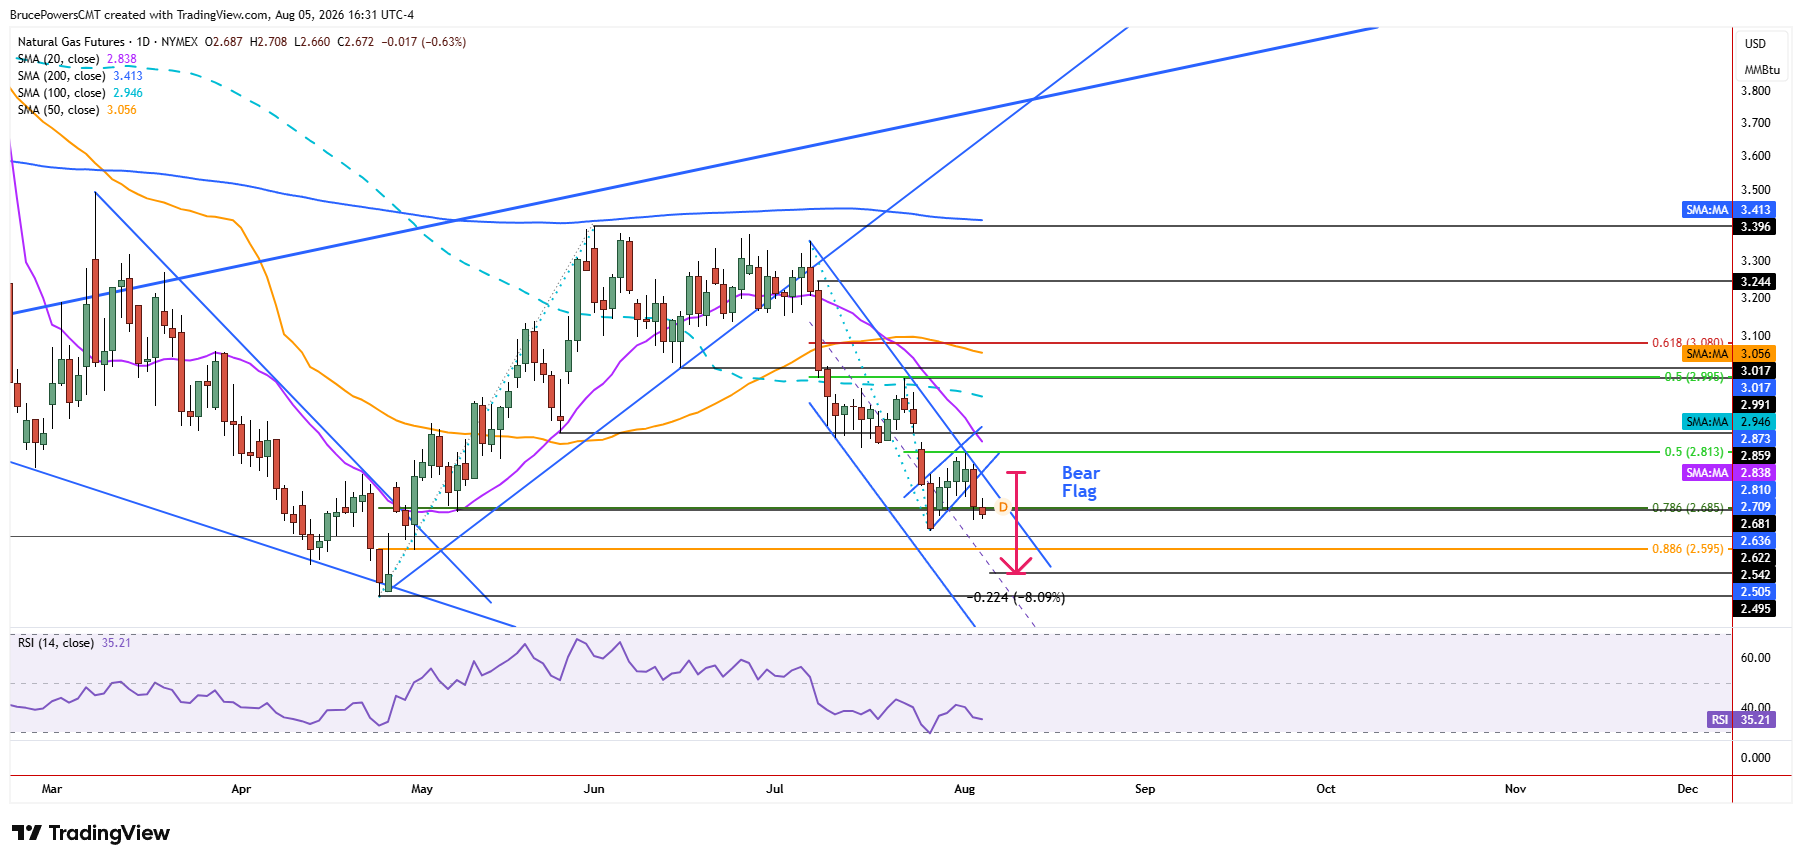
Notably, Tuesday’s high and the highs of the prior two days successfully tested resistance at the 10-day moving average before the flag triggered. Confirmation of resistance at that relatively short-term moving average prior to the pattern break provides additional bearish evidence and is supportive of further selling pressure.

Downside Targets Come into Focus
An estimated minimum downside target derived from measuring the flag pattern is around $2.54, while an interim target is near the 88.6% Fibonacci retracement near $2.60. Given the larger bearish trend structure unfolding, however, the April low of $2.50 is also at risk of failing to hold as support.
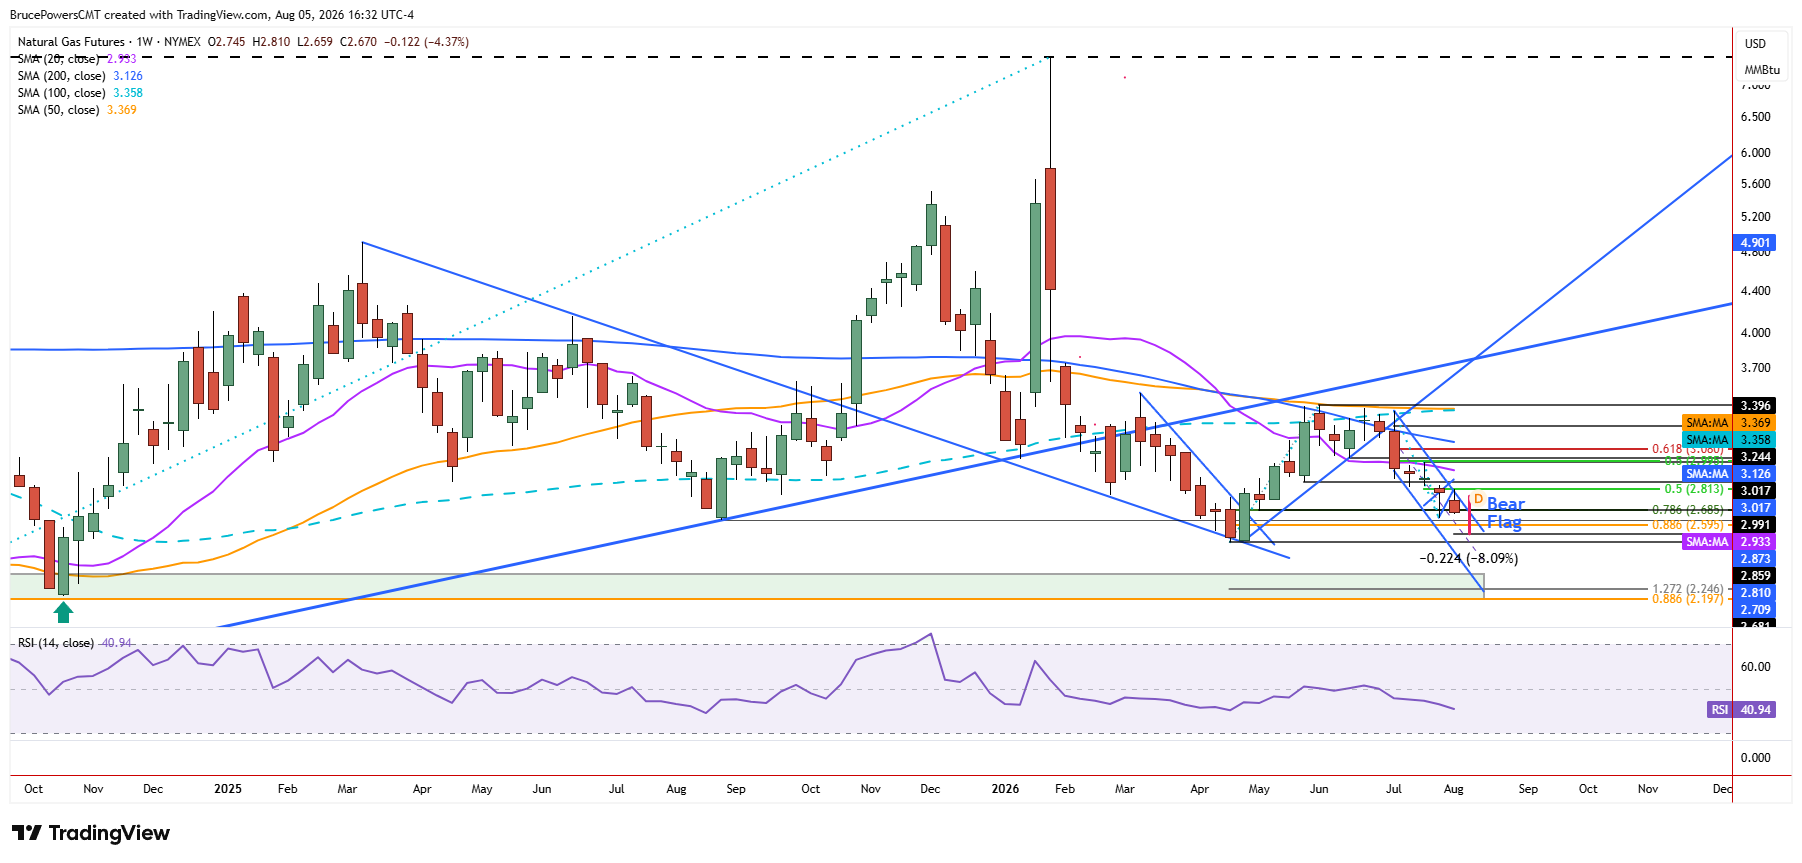
The trading range on Wednesday was relatively narrow, from $2.71 to $2.66, showing some consolidation after the sharp decline from the day before. But it occurs in the lower half of Tuesday’s range, reflecting continued downward pressure. Therefore, a decisive decline below $2.66 shows further weakness and a continuation of the decline, with the first target at the trend low near $2.64. However, given the bearish trend, a decline through that level is anticipated towards the next target below there near $2.60.
Larger Downtrend Remains Intact
Since a lower swing high was recently established at $3.40 and resistance was confirmed near the 200-day moving average, the larger bearish pattern is showing signs of potential continuation of the downtrend structure that followed the January peak of $7.44. If that pattern continues to dominate, an eventual decline below $2.50 is anticipated.
If you’d like to know more about how to trade natural gas, please visit our educational area.