



Oil and Natural Gas Markets Remain Cautious as Ceasefire Holds
Crude oil benchmarks showed restrained trading on May 27, 2026, as the conditional truce between the United States and Iran held for more than seven weeks, allowing for gradual resumption of tanker traffic through the Strait of Hormuz. With the truce holding, extreme geopolitical risk that caused high volatility in March and April has faded, allowing energy traders to refocus on traditional factors. Both WTI and Brent reflect an improving global situation as U.S. production, OPEC+ supply, and repair work have helped stabilize flows.
However, Iranian and regional flows are not back to normal. Demand has shown modest recovery in Asia following earlier price spikes, but consumption in developing countries remains subdued. Natural gas prices were mostly unchanged, as U.S. and European gas storage continued to fill during a temperate spring. In addition, the truce has eased LNG shipping tensions and contributed to softer international spot markets.
Oil markets will turn their attention to the release of the U.S. oil inventory report and the next OPEC+ meeting to see if there will be changes to oil supply. Although the truce has eased oil supply risks, the fragile truce between the United States and Iran could be disrupted at any moment.
Natural Gas Futures Stays Near $2.995, Up Blue Channel Breakout Holds
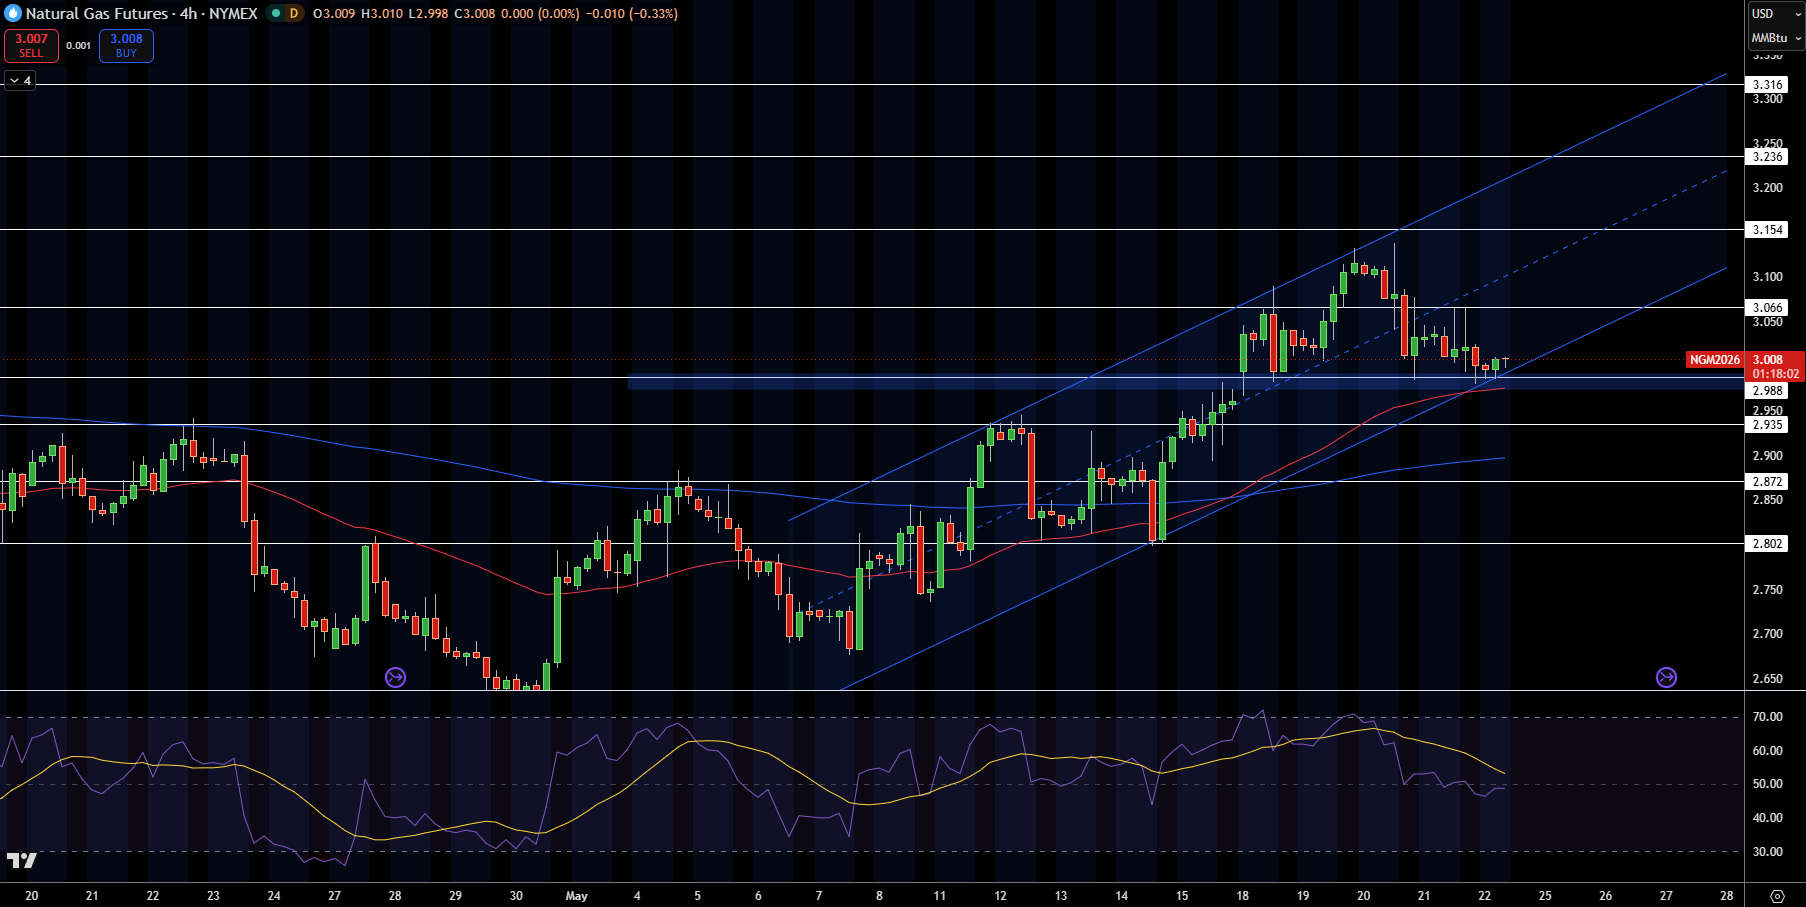
Natural Gas Futures was trading at $2.995, the 2h NYMEX price action shows green candles on the 2h and price has reclaimed the red MA below the $2.95 and then broke higher through the prior swing highs all while staying inside the blue up channel. This bullish continuation respects the white up trendline and holds the higher lows intact.
RSI is now over 55 confirming a bullish positive momentum and volume supports higher price action going forward. Price is next near the $3.008 to 3.066 area in terms of Fib extension. 2h price action has a very positive structure for all time frames above the $2.80 and we can clearly see us in a blue up channel from May 1st lows and this structure is very clean.
Trade Idea: $2.995 Long Target $3.008, Stop $2.82
WTI Crude Oil Decline Confirmed Below $92, Downward Blue Channel Broken
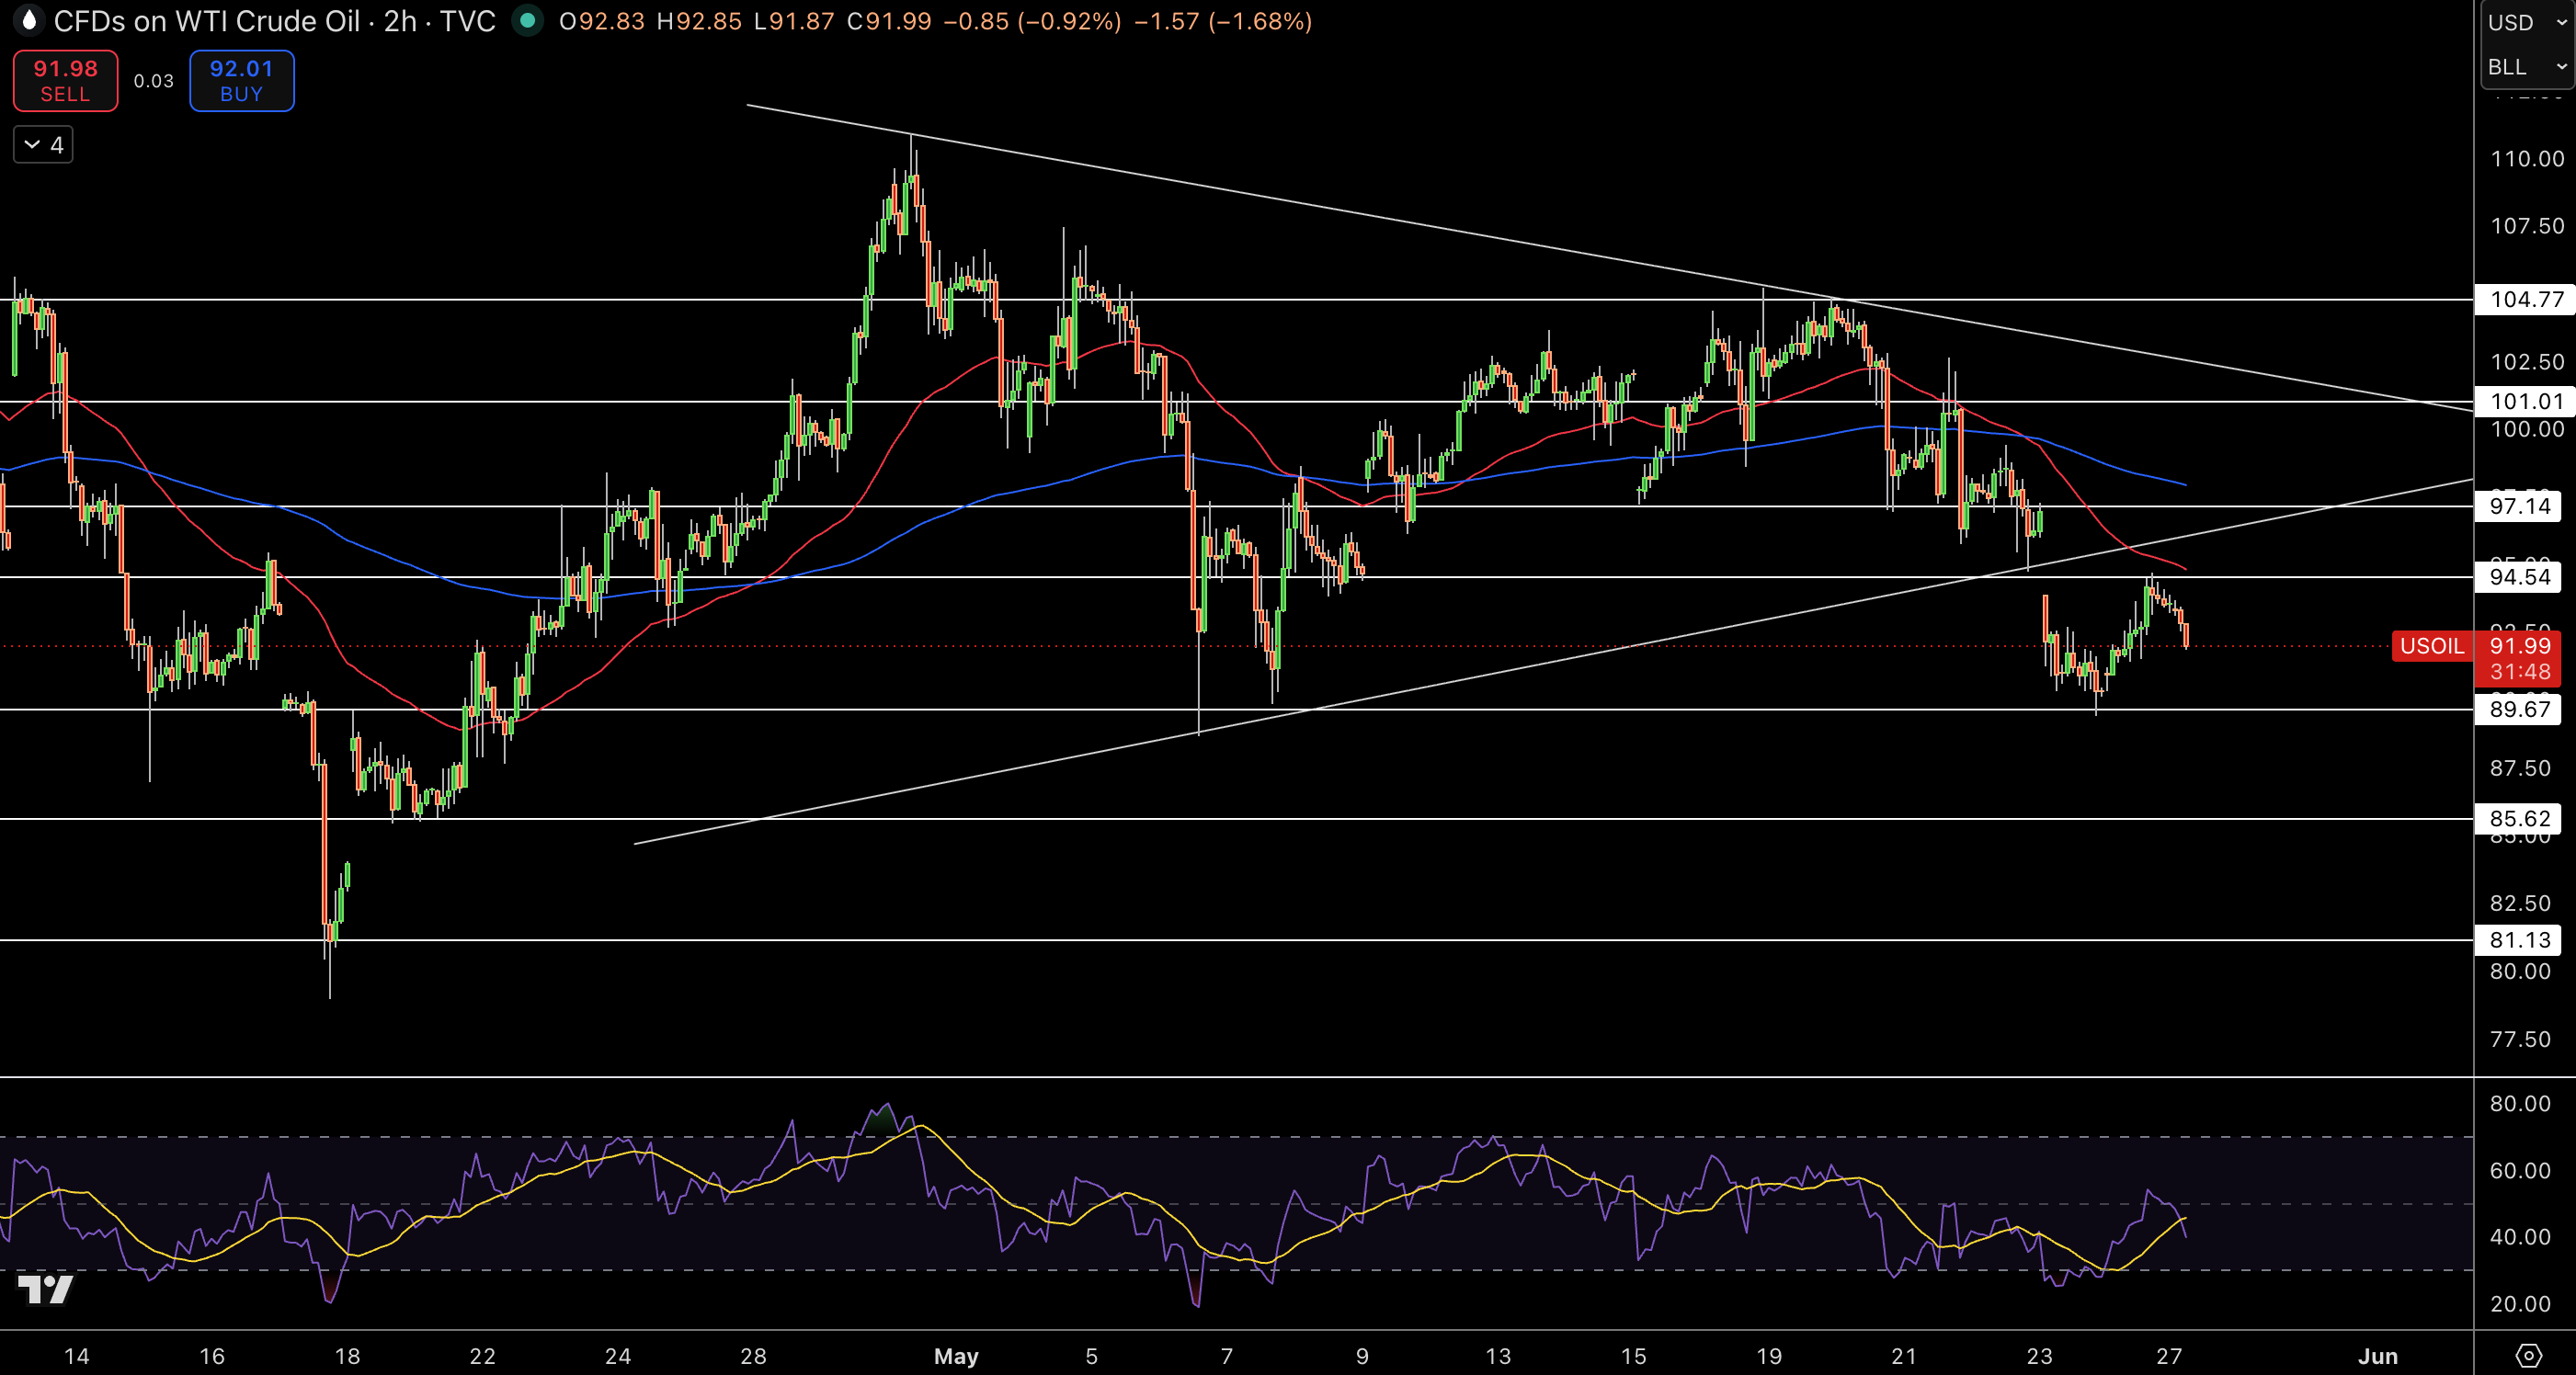
WTI was trading at $91.99, the 2h chart shows a breakdown below the blue up channel bottom at $96.05 as well as a breakdown below the red 50 MA at $98.14 and all the Fibs in a decisive red engulfing candle close. The $102.77 high continuation of this lower leg has accelerated down and is in full distribution with the bearish lower lows and wick rejections.
Natural Gas Price Forecast
Every new Natural Gas analysis as it publishes, today's technical signal and key levels, live price — on one page.
See all Natural Gas forecastsTarget will be the $89.96 Fib $88.55 extension. The RSI was at 40 and has broken below. $100 to 102 in the volume profiles is an area that has failed as fair value and we can see a dominance of sellers.
The white down trendline from May is near the $97.20 and has already capped price. We have a strongly negative structure for all time frames below $96 and are in the 2h down blue channel and it is very extended down.
Trade Idea: $91.99 Short Target $89.96, Stop $93.00
Brent Crude Oil Down $95.01, Up Blue Channel Bottom Tested
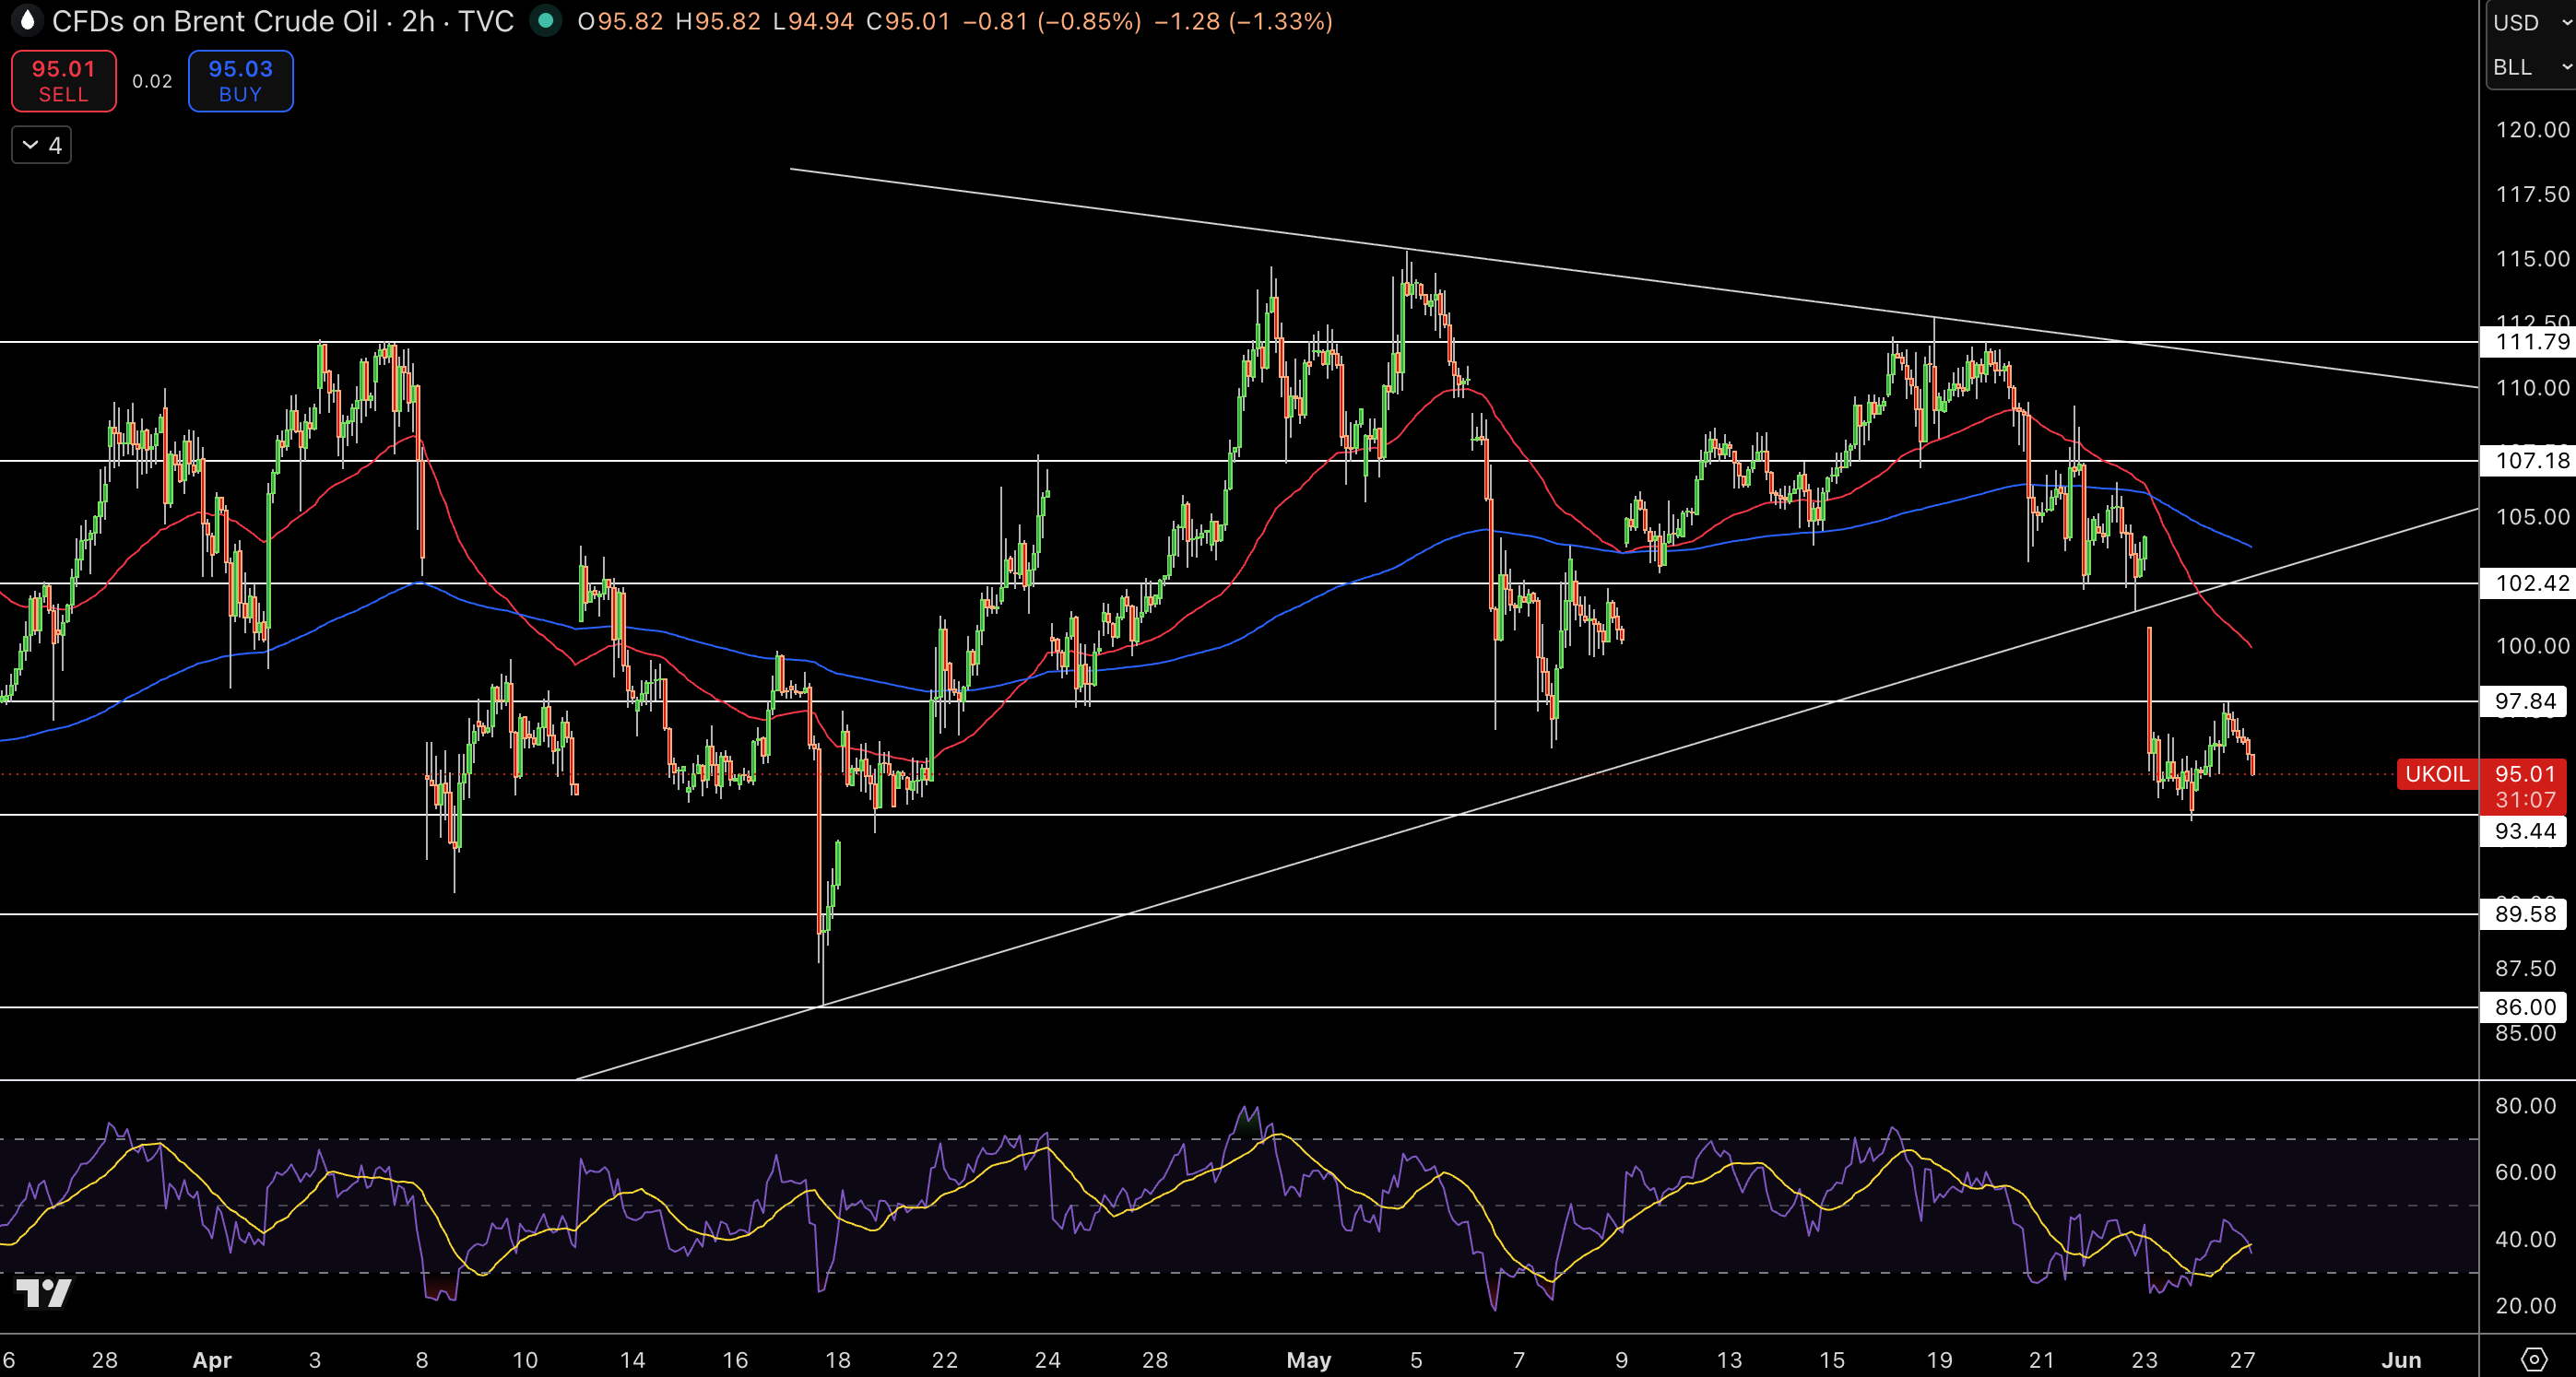
Brent Crude was trading at $95.01, the 2h chart shows red candles on the 2h and has tested the blue up channel line below and the red MA and price action near $103.10. The lower highs continue and are still lower from the recent $94 low high, however the higher lows will hold for now. RSI is hovering near 45 as a neutral to negative momentum reading.
Next Fib support is in the low $94.75. Volume profiles in the $108 to 109 will serve as the heavy supply. Structure is neutral to negative for all time frames below the 103. And the 2h price action is holding the bottom of the blue up channel from April.
Trade Idea: $95.01 Short Target $94.00, Stop $97.54