
Oil and Natural Gas Markets Stabilize as Ceasefire Holds
Crude oil was little changed on May 29, 2026, given the conditional U.S.-Iran ceasefire is more than eight weeks old and tankers continue to move through the Strait of Hormuz with gradual resumption. The peace deal has diminished the sharp geopolitical fears that contributed to the spike at the beginning of this year. As such, the oil market is now largely focused on the normal market forces. Both WTI and Brent reflect the situation on the ground.
On the supply side, high production from the U.S., continued compliance on the part of OPEC+, and increasing production by Brazil, Guyana, and Canada are keeping the flow relatively stable, even if a full return of Iranian and other regional oil is not yet the case. Meanwhile, demand is slightly better in Asia, although emerging market demand is more subdued given higher interest rates.
Natural gas was little changed, as the ceasefire has contributed to softer international spot markets. The spot market is supported by ample storage on both the U.S. and European continent. Meanwhile, longer-term Asian and European demand remains relatively strong.
The U.S. inventory data, as well as the next OPEC+ policy, will be a watch item for the oil market. As mentioned in the previous section, while the truce has reduced the geopolitical supply risk, it remains fragile and any diplomatic setbacks could quickly reintroduce volatility across the energy complex.

Natural Gas Futures are Trading at 2.995 on the 2H Chart: A Momentum-Based Breakout from the Blue Channel
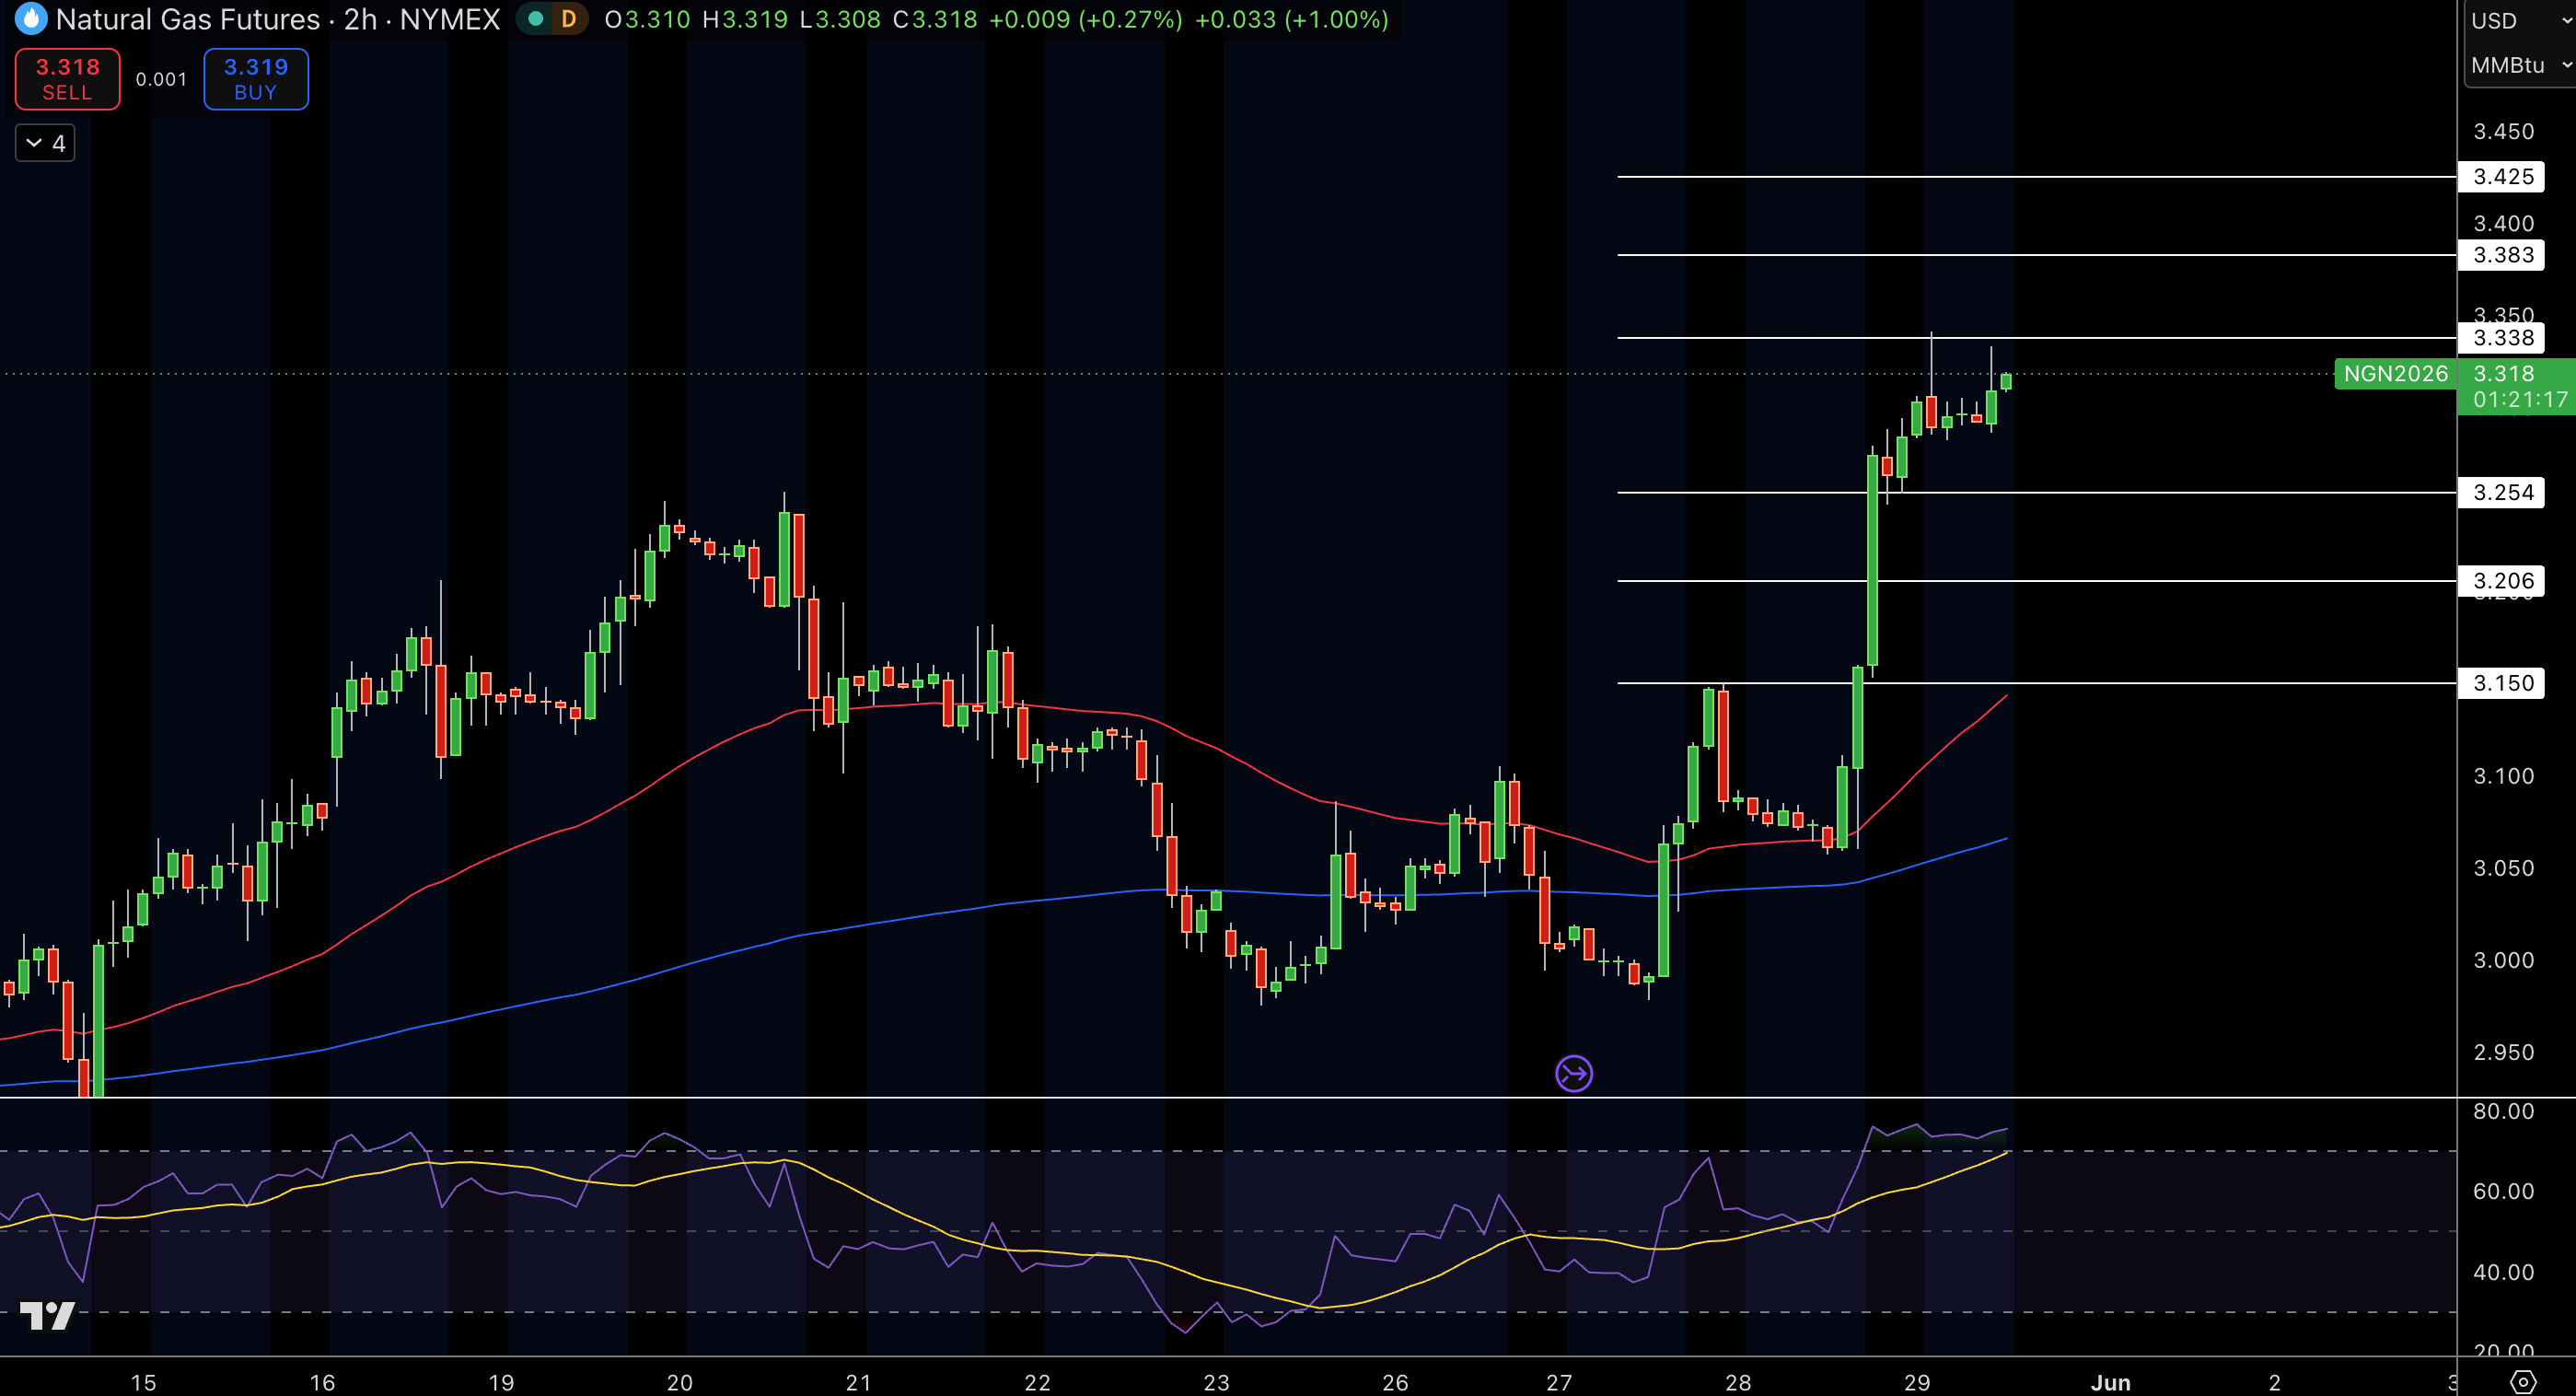
NYMEX futures are trading at $2.995 on the 2-hour timeframe. After a few large green candles, the price has pushed through the prior swing highs and back into the ascending blue channel, above the red MA (near 2.95). This move is still considered bullish in that the white trend line has been successfully tested and the recent swing lows (from May) were never lost. The momentum indicator (RSI) is currently pushing above the 55.00 level (confirming that bulls are taking control) and volume has supported the bullish move.
Price targets the 3.008-3.066 Fib extension area as the next resistance point to break. We can consider this structure decisively bullish since it remains above 2.80, while also still operating within the clean channel that was set up starting at the May lows.
Trade Idea: Buy the asset at $2.995 targeting $3.008, stop $2.82.
Natural Gas Price Forecast
Every new Natural Gas analysis as it publishes, today's technical signal and key levels, live price — on one page.
See all Natural Gas forecastsWTI Oil Dropped Below $92.00 on the 2H Chart: Blue Channel Floor Broken
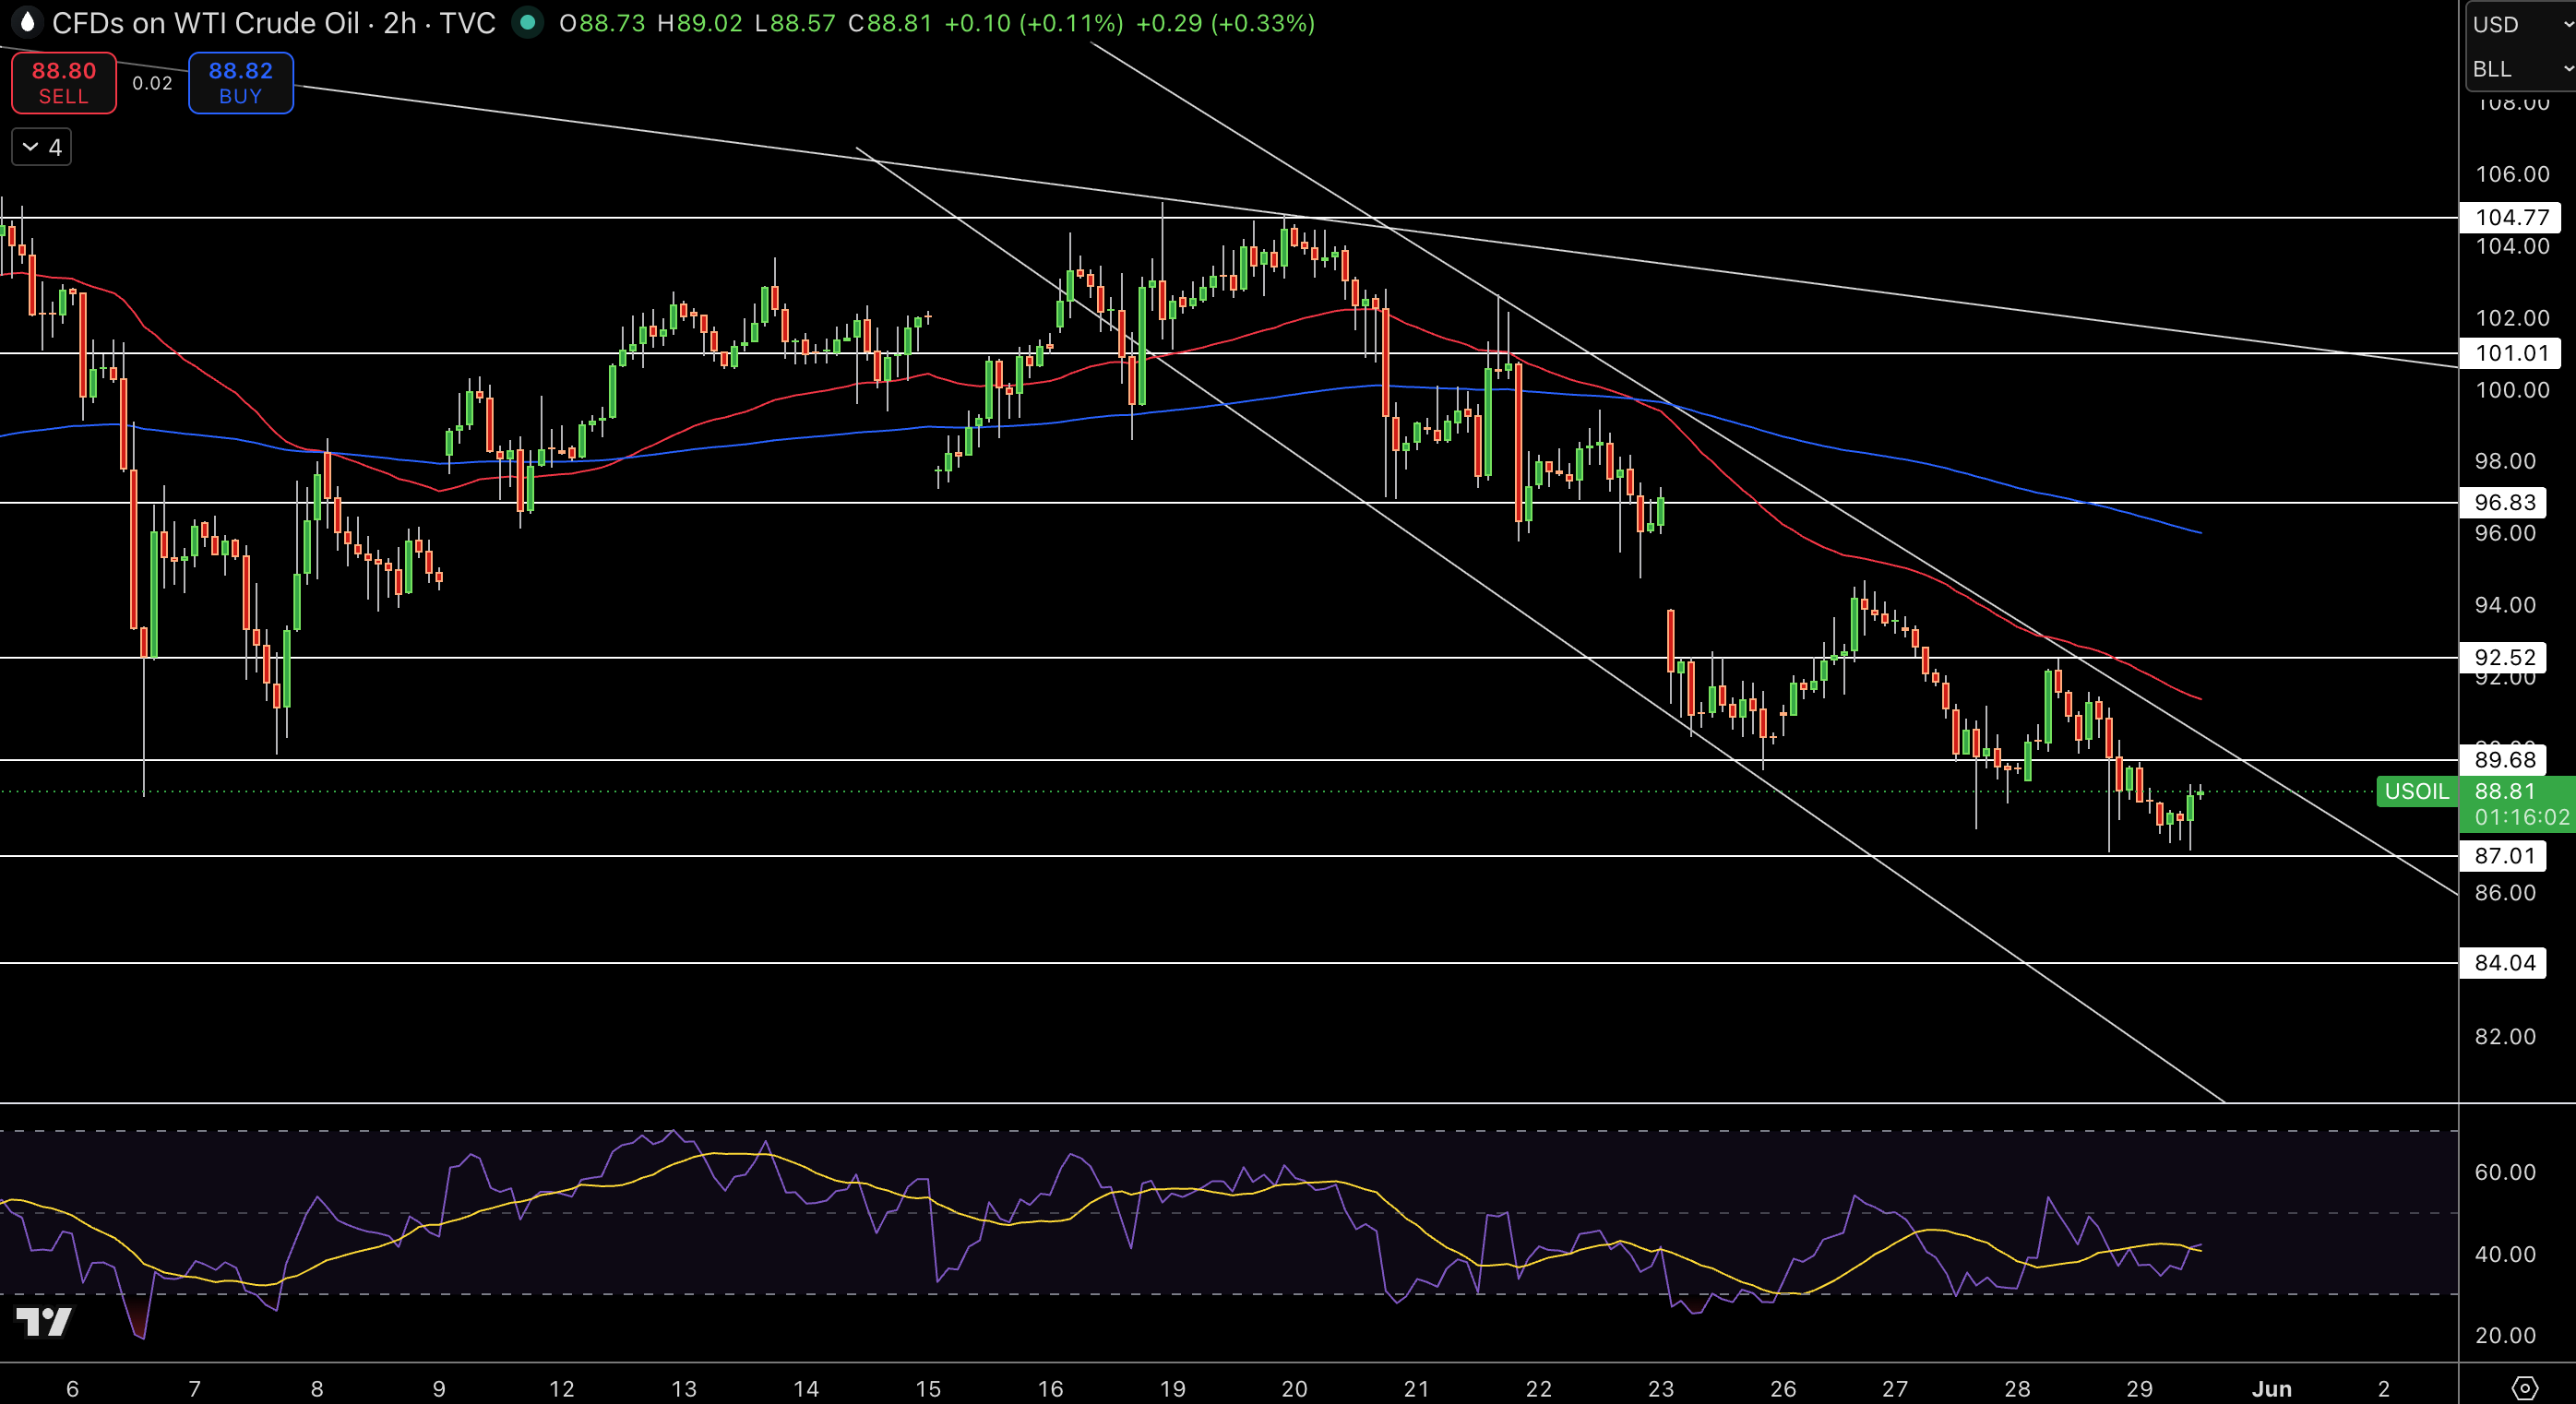
WTI is now trading at $91.99 after several big red engulfing candles pushed prices below the blue channel floor (near $96.05), the red 50-period MA ($98.14), and the entire Fib support zone. The sharp, bearish reversal that followed the 102.77 high on the 2H chart has already created a string of lower lows and rejection wicks, making it clear that distribution is ongoing and that the price is moving back toward the 89.96-88.55 Fib extension area. The red momentum indicator (RSI) has also dropped well below 40, confirming the loss of bullish momentum.
On the volume profile, we can also see that the 100.00-102.00 area has not yet become fair value, which means that the sellers are still in control of the market. The white trend line (May) now serves as resistance at 97.20. In terms of structure, the price action is currently well below the 96.00 price level (with a solid resistance zone at 96.21) and is trading within the broader declining channel that was first set up on the May highs.
Trade Idea: Sell the asset at $91.99 targeting $89.96, stop $93.00.
Brent Oil Has Fallen to 95.01 on the 2H Chart: The Blue Channel Floor Has Been Tested
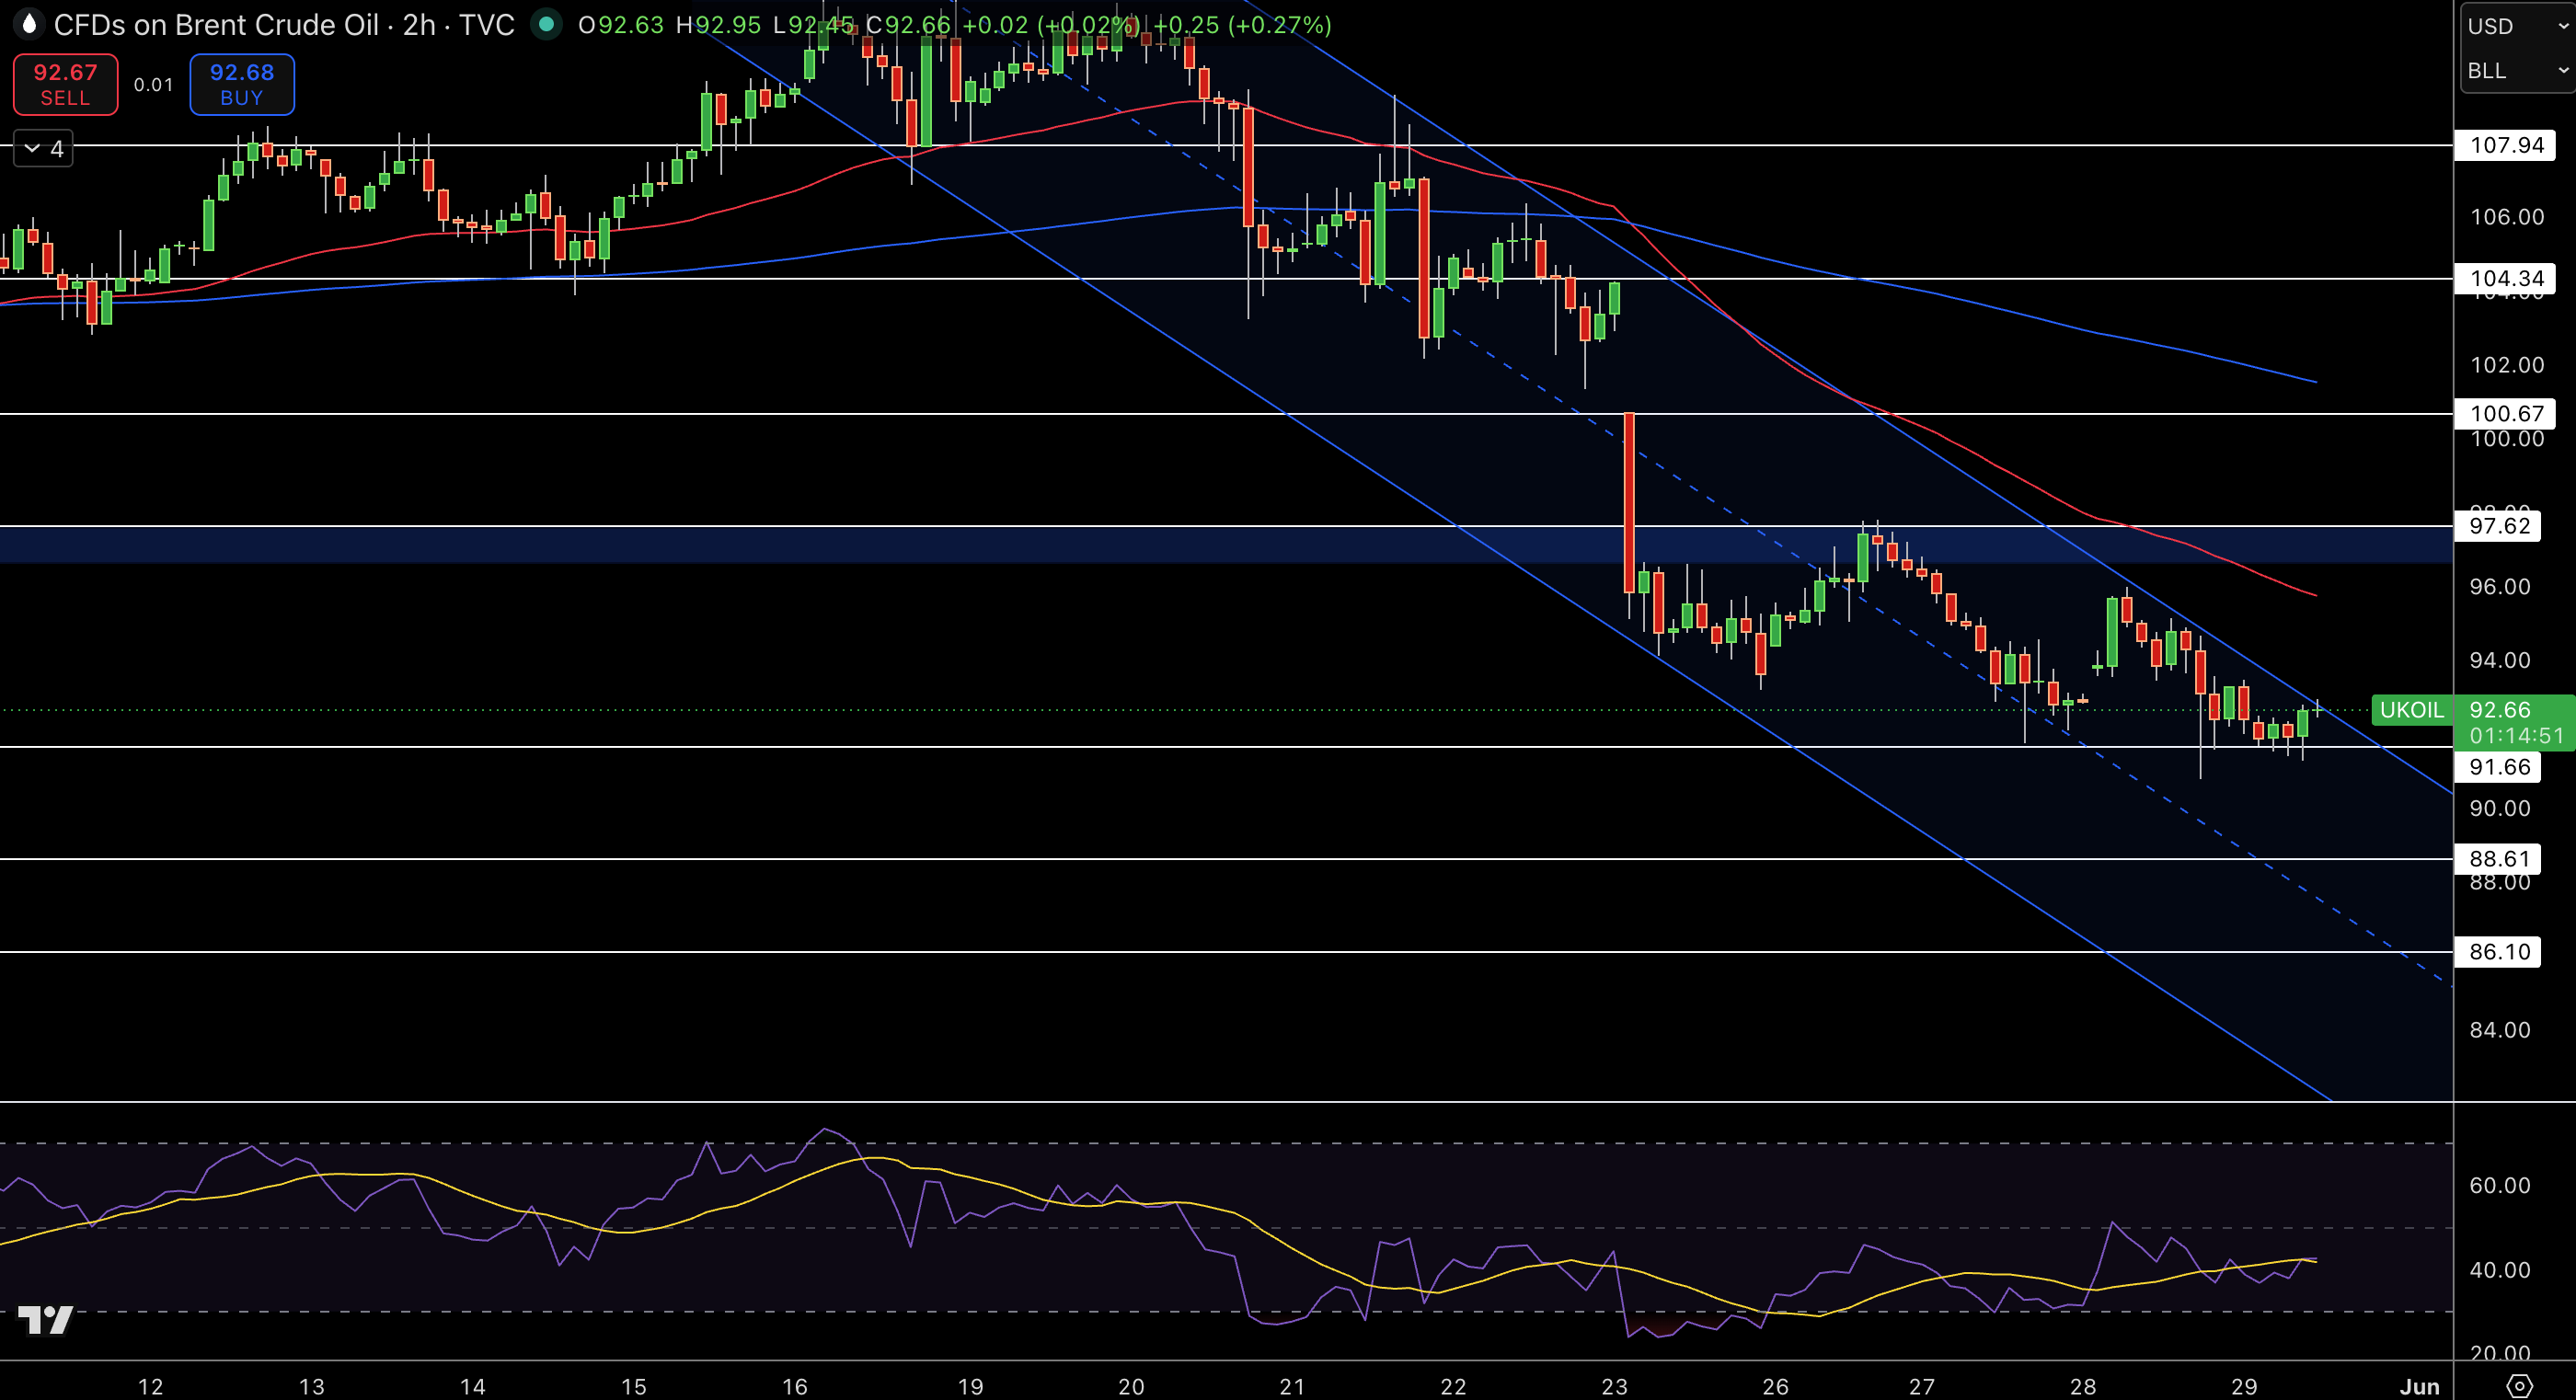
Brent crude is currently trading at $95.01 on the 2-hour time frame. After several red candles, prices have now tested the lower boundary of the blue channel line and the red moving average (near 103.10). On the short-term trend, the 94.00 low is still holding up, but the recent lower highs on the chart indicate that bearish pressure is slowly increasing. The RSI is currently hovering around the 45.00 level, suggesting that price momentum has shifted to the bearish side of neutral. Fib retracement levels indicate that prices are currently approaching the $94.75 level as the next potential support.
In the volume profile, we can see the 108.00-109.00 zone as a high supply zone. Regarding market structure, we are currently operating on a range bound to bearish bias while the price continues to defend the channel floor which has been in place since April.
Trade Idea: Sell at $95.01 targeting $94.00, stop $97.54.