
Oil and Natural Gas Markets Remain Range-Bound as Ceasefire Stability Persists
Oil prices were sluggish on Tuesday, May 26, 2026, reflecting how a conditional ceasefire between Iran and the United States, over seven weeks old, seems still hold and more tankers are now passing safely through the Hormuz Strait. The deal has calmed the geopolitical risk to a point where it no longer looms as large of a threat as it did during March and early April, giving traders room to turn their attention to the usual demand and supply factors.
Both WTI and Brent are pricing in a more level international supply and demand. Oil production in the United States continues to be strong and output from OPEC+ has been adjusted in order to balance markets. Meanwhile oil from affected Middle East regions is still recovering from damage sustained during the conflict. Oil demand has rebounded a little in Asian markets as consumers reacted to the previous sharp prices hikes, but demand remains low elsewhere due to the sensitivity of many countries to price.
Natural gas trades quietly, as good weather keeps storage at reasonable levels in the US and Europe. The ceasefire has also eased tensions in the international shipping of natural gas from the Middle East and LNG demand to Asia and Europe is expected to remain healthy.
Traders are waiting for the next US weekly storage report and the next announcement from OPEC+ on oil output. While the truce may lower the chances of short term disruptions, it may prove to be short-lived.

Natural Gas Climbs to $2.937 Following Blue Channel Breakout
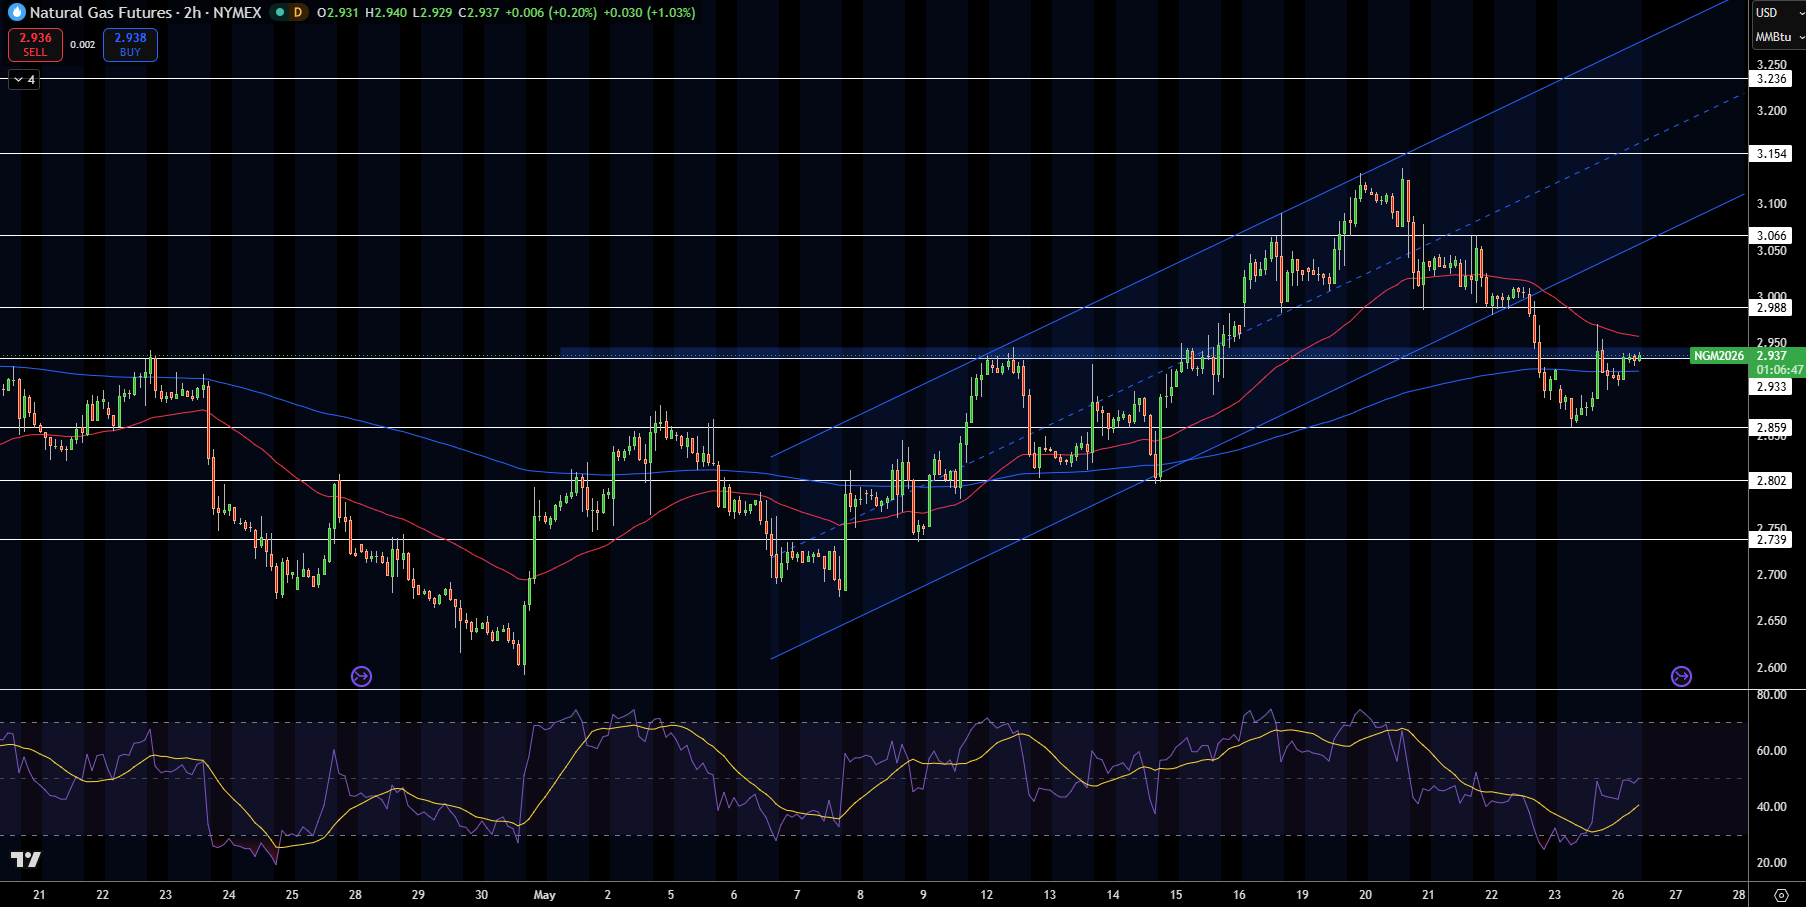
Natural Gas futures are trading at $2.937 on the 2-hour NYMEX timeframe, as bullish green candles reclaimed a support from the red moving average of 50-period around $2.95 and higher highs inside the ascending blue channel were tested. A white trendline is acting as support for a bullish continuation and higher lows remain intact on price action. RSI is above 55 confirming that bullish momentum is picking up.
The bullish move has volume support as seen on a chart. Resistance is next seen near the Fib extension of $3.008 to $3.066. Structure is bullish as long as price stays above $2.80 on a clean ride up a channel since May lows.
Trade idea: buy $2.937 targeting $3.008, with a stop at $2.82.
Natural Gas Price Forecast
Every new Natural Gas analysis as it publishes, today's technical signal and key levels, live price — on one page.
See all Natural Gas forecastsWTI Slides Beneath $92 Following Blue Channel Failure
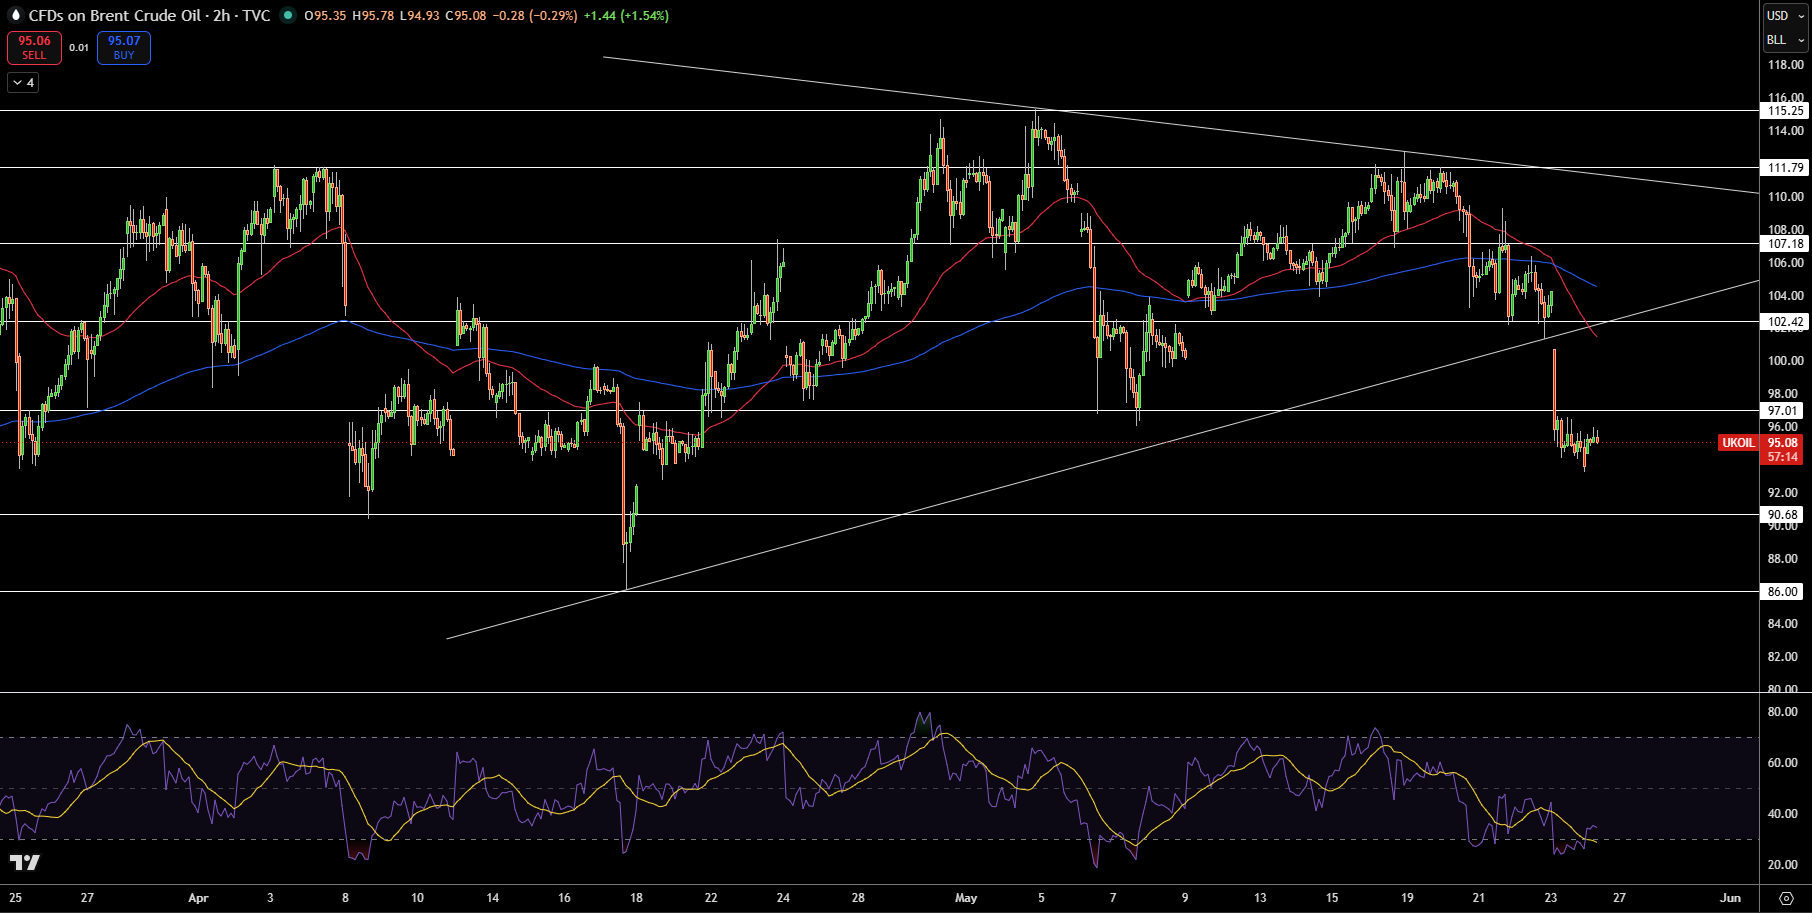
WTI fell to $91.69 on the 2-hour timeframe, following a bearish engulfing setup below the support offered by the ascending blue channel on its floor near $96.05, the red moving average at 50-period at $98.14 and other Fibonacci level support from recent months. From $102.77, bearish continuation is gaining traction as we see strong lower lows and the recent bearish momentum is gaining support via its rejection wicks. Expect the decline to push towards the Fibonacci extension zone of $89.96 to $88.55. RSI is below 40 confirming that momentum is in the hands of the sellers.
According to the volume profile data, a fair value zone for buyers of $100 to $102 was rejected and sellers are in charge. The white descending trendline from May is at play here and a failed bullish rally is seen from May lows in the area of $97.20. Structure is still bearish as long as we stay beneath $96, and as price is moving within an extended down-channel. On higher timeframes, a key resistance is seen at the pivot $96.21.
Trade idea: sell $91.69 towards $89.96, with a stop at $93.00.
Brent Retreats to $95.08, Tests Bottom Of Blue Channel
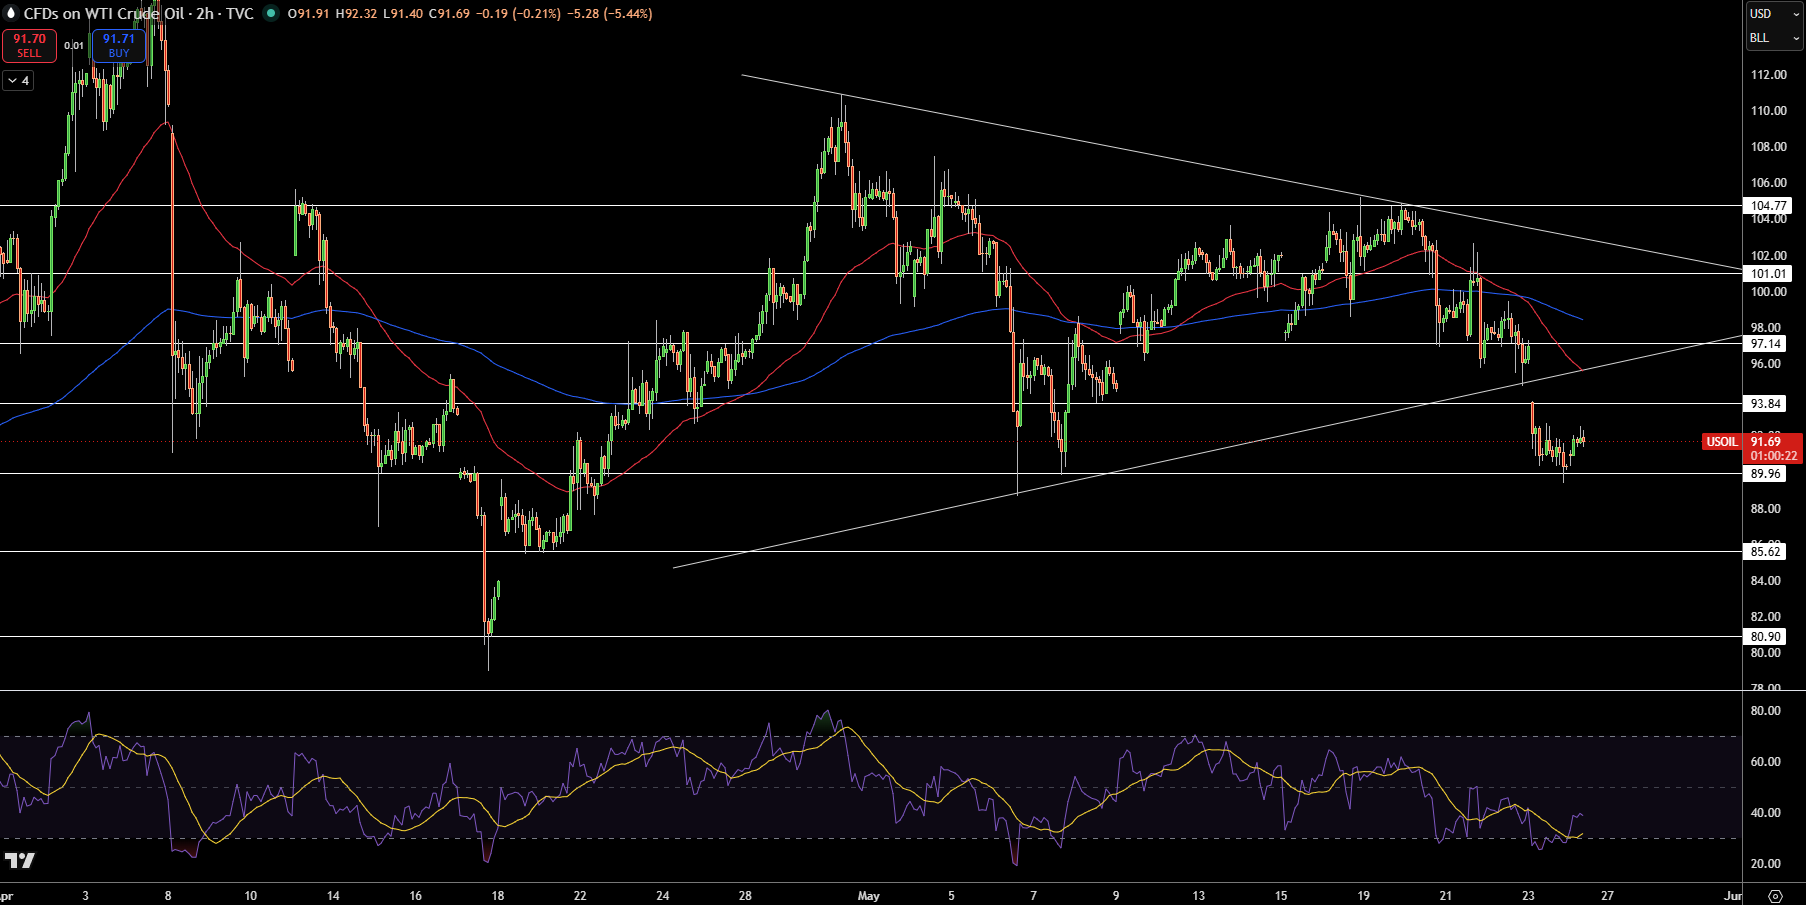
Brent is trading at $95.08 on the 2-hour chart, after a bearish pattern of red candles tested the lower blue line from the blue channel and the lower support of the red moving average in 50-period timeframe near $103.10. A higher low of $94 is still in force but higher highs on the price are starting to fade. RSI is hovering around the 45 mark, signaling either a neutral or bearish bias.
The first Fibonacci level to test will be a support in the area of $94.75. Volume profile data suggests heavy seller supply near $108 to $109. Structure is still neutral-bearish, until price stays below the moving average at $103 as the price defends itself from the ascending lower blue channel from April.
Trade idea: sell $95.08 towards $94.00, with a stop at $97.54.