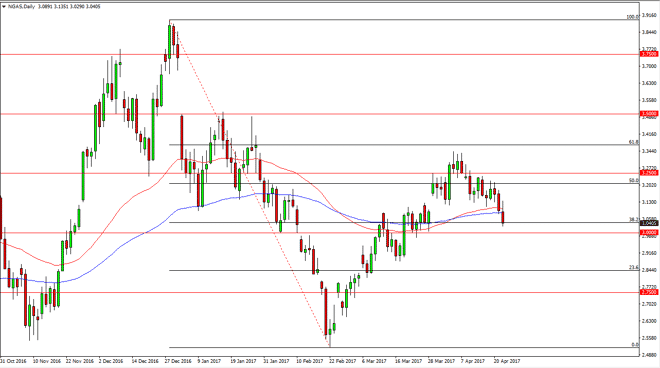
The natural gas markets initially tried to rally on Monday but then fell significantly. We are below the $3.05 level, and that is a very negative sign.
The natural gas markets initially tried to rally on Monday but then fell significantly. We are below the $3.05 level, and that is a very negative sign. However, I also recognize that the $3.00 level underneath will be support also, so we need to clear that to start selling. Alternately, if we turn around a break above the top of the bearish candle for the Monday session, that would be positive. I think a little bit of patience will show the way in this market going forward. Natural gas suddenly looks very bearish.
Chris is a proprietary trader with more than 20 years of experience across various markets, including currencies, indices and commodities. As a senior analyst at FXEmpire since the website’s early days, he offers readers advanced market perspectives to navigate today’s financial landscape with confidence.