Natural gas markets initially tried to rally during the Tuesday session but fell flat and ended up falling towards the $3.04 level. The 50 day and the
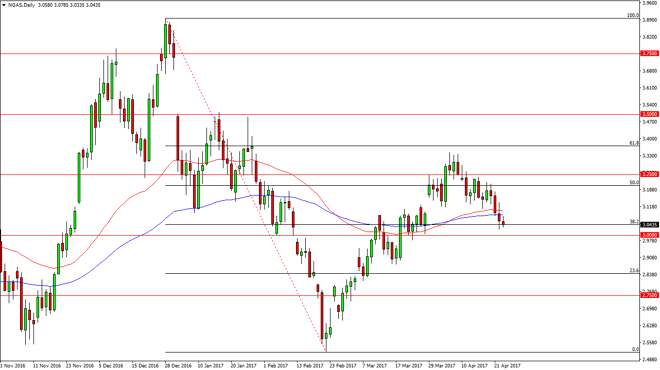
Natural gas markets initially tried to rally during the Tuesday session but fell flat and ended up falling towards the $3.04 level. The 50 day and the 100-day exponential moving averages are just above, and that of course is a negative sign. More importantly though, I see the $3 level underneath as being massively supportive so I think a breakdown below there would trigger a lot of selling. A break above the top of the 2 moving averages I have on the chart could be a bullish sign, but I would expect that it would run into quite a bit of noise above.
Chris is a proprietary trader with more than 20 years of experience across various markets, including currencies, indices and commodities. As a senior analyst at FXEmpire since the website’s early days, he offers readers advanced market perspectives to navigate today’s financial landscape with confidence.