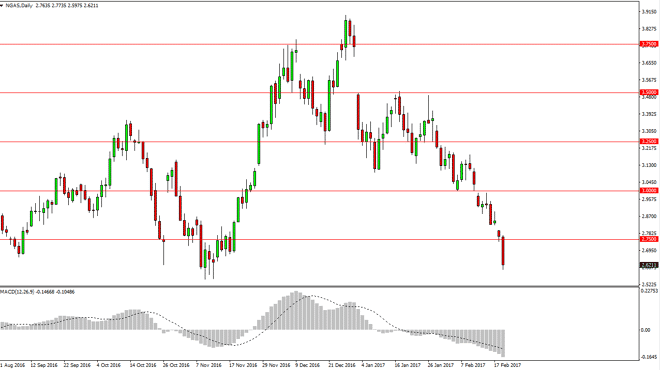
We broke down below the 2.75 level during the day on Tuesday, showing extreme bearishness. We in fact reached towards the 2.60 level underneath, which has
We broke down below the 2.75 level during the day on Tuesday, showing extreme bearishness. We in fact reached towards the 2.60 level underneath, which has been a massive floor in the past. I believe that we could have a bounce from here, but the 2.75 level above should now be massively resistant. I believe the natural gas markets have much farther to go, but we are getting a little bit oversold. Ultimately, natural gas is a market that offers no opportunities to buy unless of course you are comfortable going against the trend.
Chris is a proprietary trader with more than 20 years of experience across various markets, including currencies, indices and commodities. As a senior analyst at FXEmpire since the website’s early days, he offers readers advanced market perspectives to navigate today’s financial landscape with confidence.