As many of you know, I have been extraordinarily bearish of natural gas for a very long time. I live in a region of the United States that has a lot of
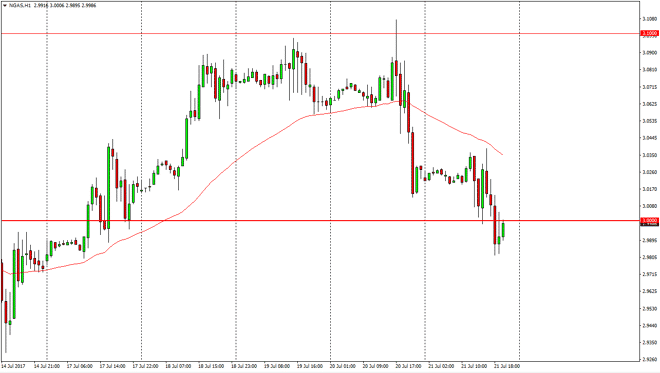
As many of you know, I have been extraordinarily bearish of natural gas for a very long time. I live in a region of the United States that has a lot of natural gas drilling, and I can tell you from first-hand account, we have more natural gas that we need in the United States. In fact, there’s over 300 years’ worth of proven natural gas reserves. Because of this, every time this market rallies I’m looking for an opportunity to sell. Friday was an excellent example of a market that had gotten overheated. We went sideways initially, and then broke down below the psychologically significant $3 barrier. I believe that the market is going to go down to the $2.85 level and the short-term, but eventually will find itself working towards the $2.50 level.
I continue to sell rallies in this market, and I believe that at the first sign of weakness, it’s time to start selling again. The $3.10 level above has been a massive barrier that has held firm. I don’t see the reason that will change anytime soon, so I believe that every time we approach the 24-exponential moving average on the hourly chart, we will probably continue to have a reaction. At each fresh, new low, I would be adding to my short position as well. I’m very aggressive to the downside in this market when I get the opportunity, and this looks like the beginning of a move much lower.
Chris is a proprietary trader with more than 20 years of experience across various markets, including currencies, indices and commodities. As a senior analyst at FXEmpire since the website’s early days, he offers readers advanced market perspectives to navigate today’s financial landscape with confidence.