Natural gas markets had a negative candle form during the week, as we reached towards the $3.25 level. That’s an area that seems to be offering quite a
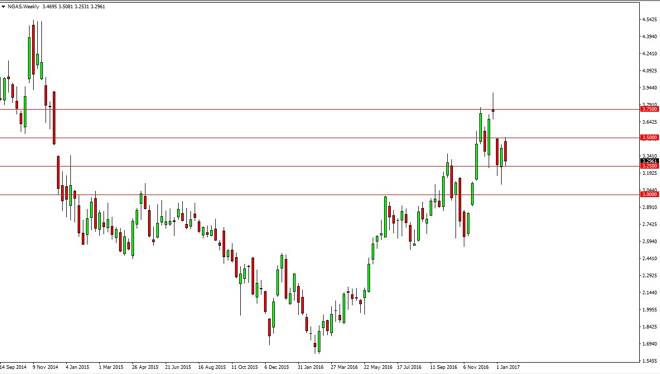
Natural gas markets had a negative candle form during the week, as we reached towards the $3.25 level. That’s an area that seems to be offering quite a bit of support, but I do think that the massive gap from three weeks ago, will continue to be on the mind of longer-term traders. I believe that this market will eventually break down but it is probably going to be a market it’s better traded off short-term charts because of all the volatility. With this being the case, I am on the sidelines as far as longer-term charts are concerned.
Chris is a proprietary trader with more than 20 years of experience across various markets, including currencies, indices and commodities. As a senior analyst at FXEmpire since the website’s early days, he offers readers advanced market perspectives to navigate today’s financial landscape with confidence.