
Advertisement
Advertisement
Natural Gas Fundamental Analysis – Forecast for the Week of January 16, 2017
By:
Natural gas futures started the week under pressure, driven by both technical and fundamental factors, but by the end of the week, enough buying came in
Natural gas futures started the week under pressure, driven by both technical and fundamental factors, but by the end of the week, enough buying came in to fuel a strong rebound rally into Friday’s close.
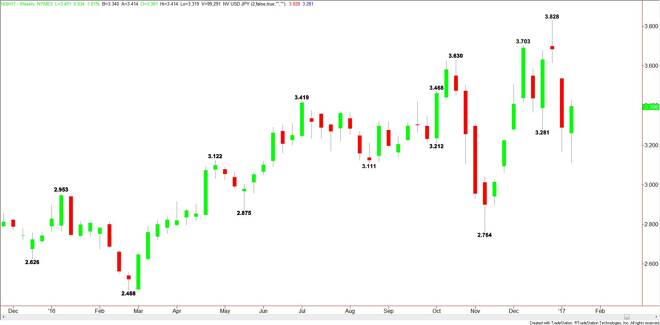
For the week, March Natural Gas futures closed at $3.396, up $0.108 or +3.28%.
On January 9, March Natural Gas hit its lowest level since November 23 at $3.100. The catalysts for the sell-off were forecasts of warmer weather and lighter heating demand into the end of January. At the start of the new week, updated weather forecasting models showed above normal temperatures were expected throughout large portions of the southern and eastern U.S. through January 23.
Despite the close on its low and momentum heading lower, the very next day, prices bounded and never looked back the rest of the week. The recovery was due to a change in the forecasts that now called for colder temperatures into the end of January.
The market received a further boost on January 12, climbing to a one-week high after data showed that natural gas supplies in storage in the U.S. fell more than expected the week-ending January 6.
According to the U.S. Energy Information Administration, natural gas in storage in the U.S. declined by 151 billion cubic feet, exceeding market expectations for a drop of 144 billion cubic feet.
At the end of the week, total natural gas in storage stood at 3.160 trillion cubic feet, 10.3% lower than levels at this time a year ago and around 0.1% below the five-year average for this time of year.
Forecast
Technical analysis played a role in last week’s rally by natural gas as investors reacted to a key resistance zone on the charts at $3.296 to $3.170. Although the market dipped to $3.110, buyers quickly came in on the move, trapping fresh short-sellers who sold weakness and confounding long investors who exited out of fear of lower prices. The chart pattern ended up being a typical bear trap. This often occurs at the end of sharp sell-offs.
Based on the short-term range of $3.828 to $3.110, the first upside objective this week is $3.469 to $3.554. Trader reaction to this zone will determine the near-term trend of the market. Sellers are going to come in and try to form a potentially bearish lower top. Buyers are going to drive the market through this zone in an attempt to make $3.110 an important bottom.
On the downside, the major support remains $3.296 to $3.170.
Last week’s price action was a combination of short-covering and weather related buying. At week’s end, the weather forecasts indicates the possibility of low natural gas demand. In order to sustain last week’s rally, we’re going to have to see a change in the forecast to colder weather into the end of the month, or prices are likely to test last week’s lows once again.
About the Author
James Hyerczykauthor
James Hyerczyk is a U.S. based seasoned technical analyst and educator with over 40 years of experience in market analysis and trading, specializing in chart patterns and price movement. He is the author of two books on technical analysis and has a background in both futures and stock markets.


Advertisement