Breakout Above Neckline Signals Bullish Reversal
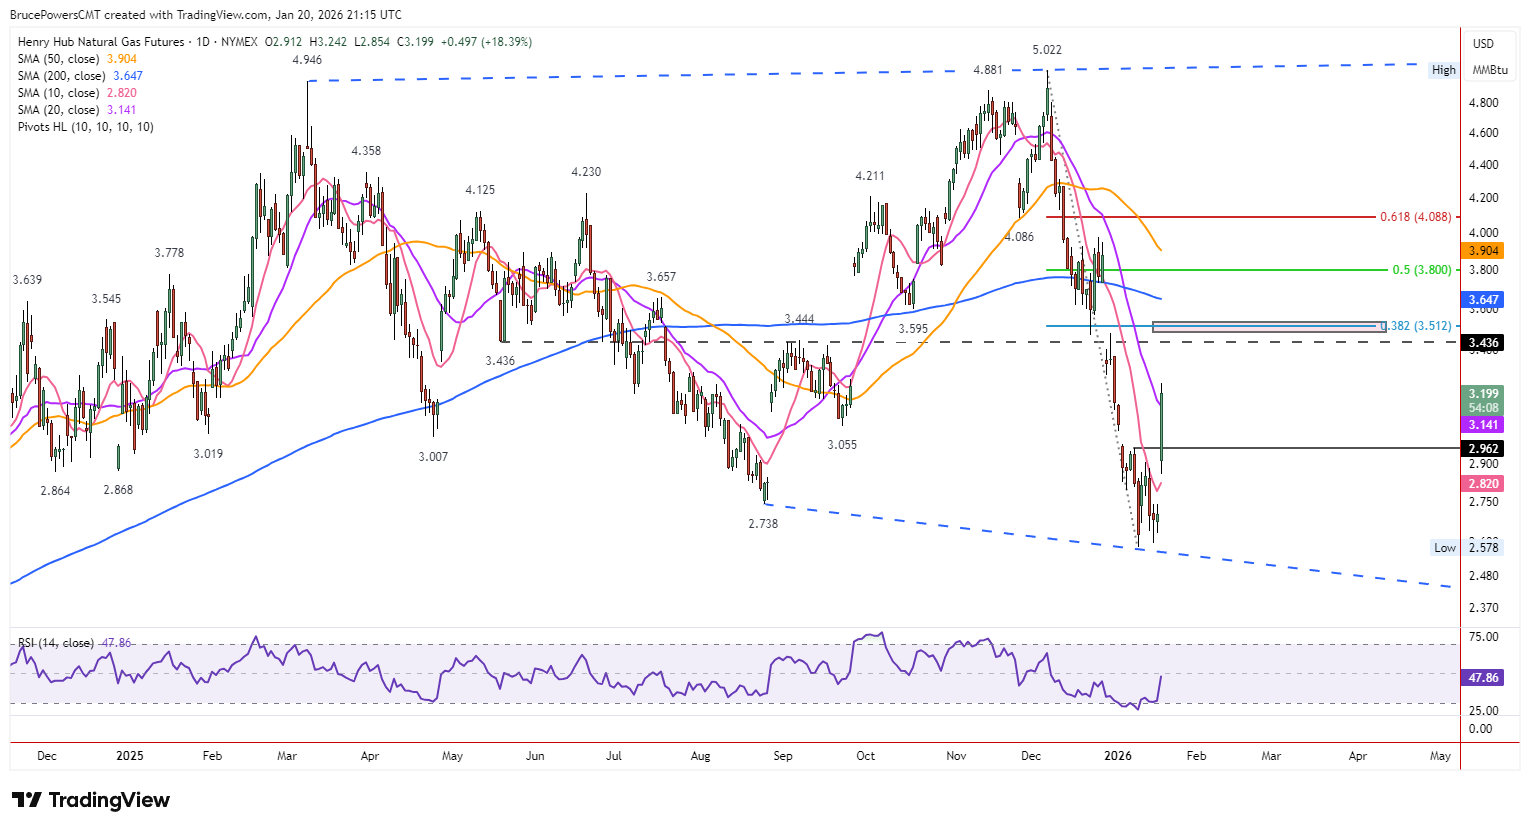
Natural gas spiked to a high of $3.22 on Tuesday as it attempted to reclaim the 20-day moving average, now at $3.14. A bullish reversal signal triggered above the lower swing high at $2.90, which is also the neckline of a double bottom pattern. That is bullish behavior that is strengthened by continued momentum following the breakout. If natural gas can end the day above the 20-day average, it will indicate remaining underlying demand that should help move prices higher.

Broadening Formation Supports Upside Attempt
The double bottom breakout confirmed a lower swing low at $2.56 for this month and a bounce off the bottom of a developing broadening formation. Once a reversal occurs from one side of the formation, the other side becomes a potential target. Even though the upside target at the top of the formation may not be reached, the bullish reversal suggests that a solid attempt to advance towards recent highs up to $5.02 is a possibility. That logic increases the chance the lower target may be reached.
Fibonacci and Moving Averages Define Upside Targets
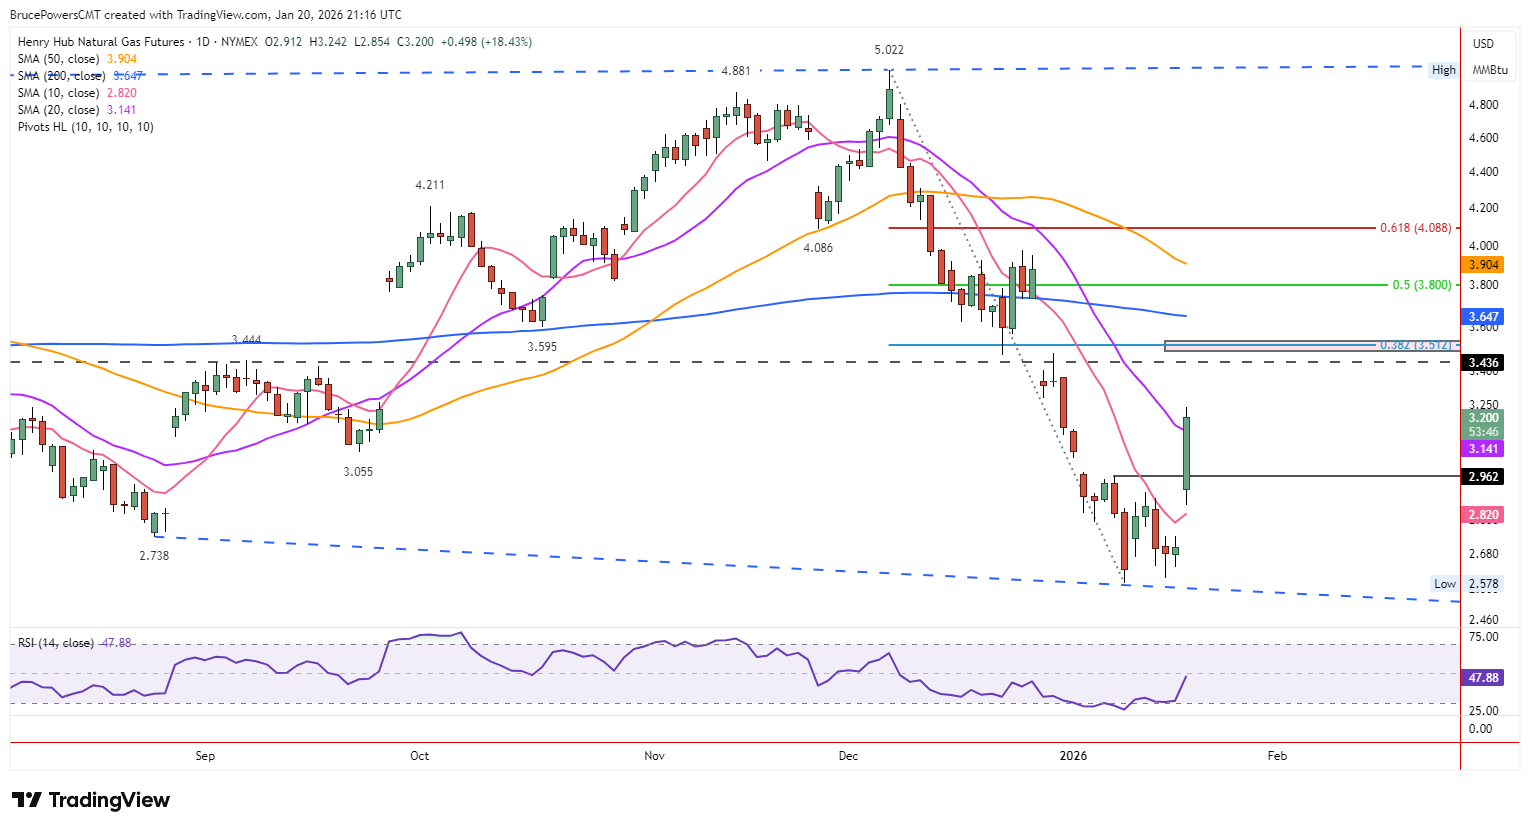
With buyers taking control an initial upside target around 38.2% Fibonacci retracement at $3.51 is looking more likely as an initial expectation. A little higher is the falling 200-day average at $3.65, which may present more formidable resistance. The developing rally is the first time that the 200-day line will be tested as resistance since it failed as support in late-2025.
Currently, it is close to aligning with the October higher swing low support level at $3.60. A bounce from the October low confirmed support near the 200-day line. So, maybe a reversal sequence results in the current counter-trend rally hitting formidable resistance at the confluence of the 200-day average and prior support at $3.60. For now, that would be an initial upside target for this rally.
Natural Gas Price Forecast
Every new Natural Gas analysis as it publishes, today's technical signal and key levels, live price — on one page.
See all Natural Gas forecastsSupport Levels Guide Near-Term Pullbacks
Short-term support is at the double bottom neckline at $2.96, followed by this week’s low of $2.85 and the 10-average at $2.82. Nonetheless, a daily close above the 20-day average will confirm strong demand that should take the price of natural gas higher. This doesn’t mean that short-term weakness doesn’t follow, but if it does, it will likely be used for accumulation.
If you’d like to know more about what drives natural gas prices, please visit our educational area.