Short-Term Recovery Within Larger Downtrend
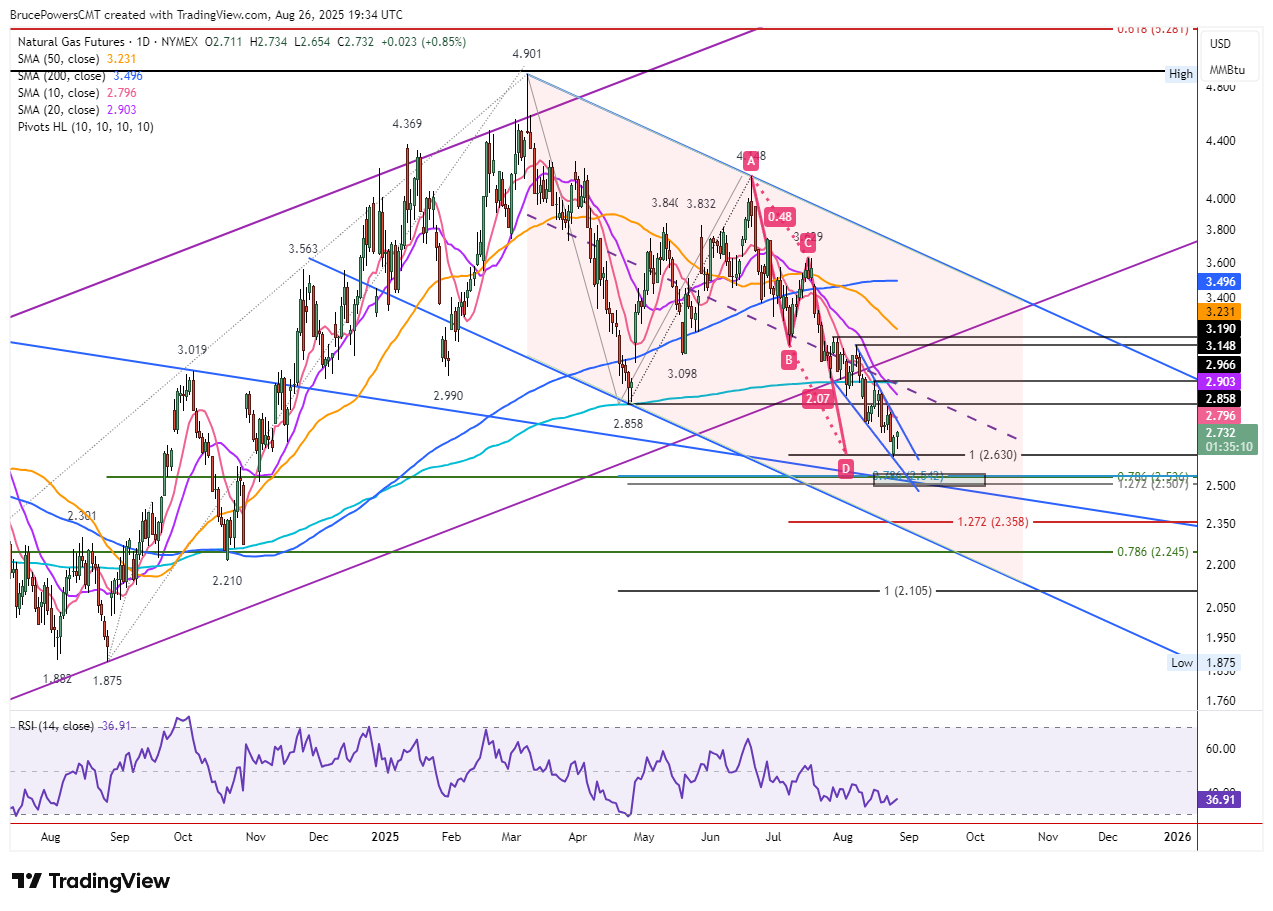
Natural gas remains in a clear downtrend, and any signs of strength are so far contained within a larger bearish trend structure. On Tuesday, natural gas advanced above Monday’s high to reach $2.73, with a higher daily low at $2.64. Monday’s session had seen a dip to a new trend low of $2.62 before recovering above the prior trend low at $2.69 and closing higher. That rebound is short-term bullish behavior and has led into today’s minor bounce, though the broader trend remains bearish.

Falling Wedge and Key Resistance Levels
The current decline is unfolding within a falling wedge consolidation pattern, with the upper boundary aligning near the 10-Day moving average, now at $2.79. Just above that, potential resistance converges at the most recent interim swing high of $2.85 and the April swing low of $2.86. Together, they define a key resistance zone. A sustained rally above $2.86 would be required to signal that the bulls might be regaining control and the wedge breakout is showing signs of success. Until then, the path of least resistance remains lower.
Potential Downside Targets
If the bearish structure extends, the next potential support zone sits between $2.54 and $2.51. This area includes a 78.6% Fibonacci retracement at $2.54, along with a long-term trendline drawn from the 2023 peak. How effective that support becomes will depend on the timing and strength of any test.
Bullish Wedge Reversal Scenario
Despite the bearish bias, the wedge pattern leaves room for a bullish reversal. If a confirmed breakout occurs, the standard target points back to the origin of the wedge around $3.15 to $3.19. Until that happens, the 10-Day moving average should be monitored closely as it has consistently acted as dynamic resistance since the decline that began on August 11.
For a look at all of today’s economic events, check out our economic calendar.