


Decisive Reversal Monday
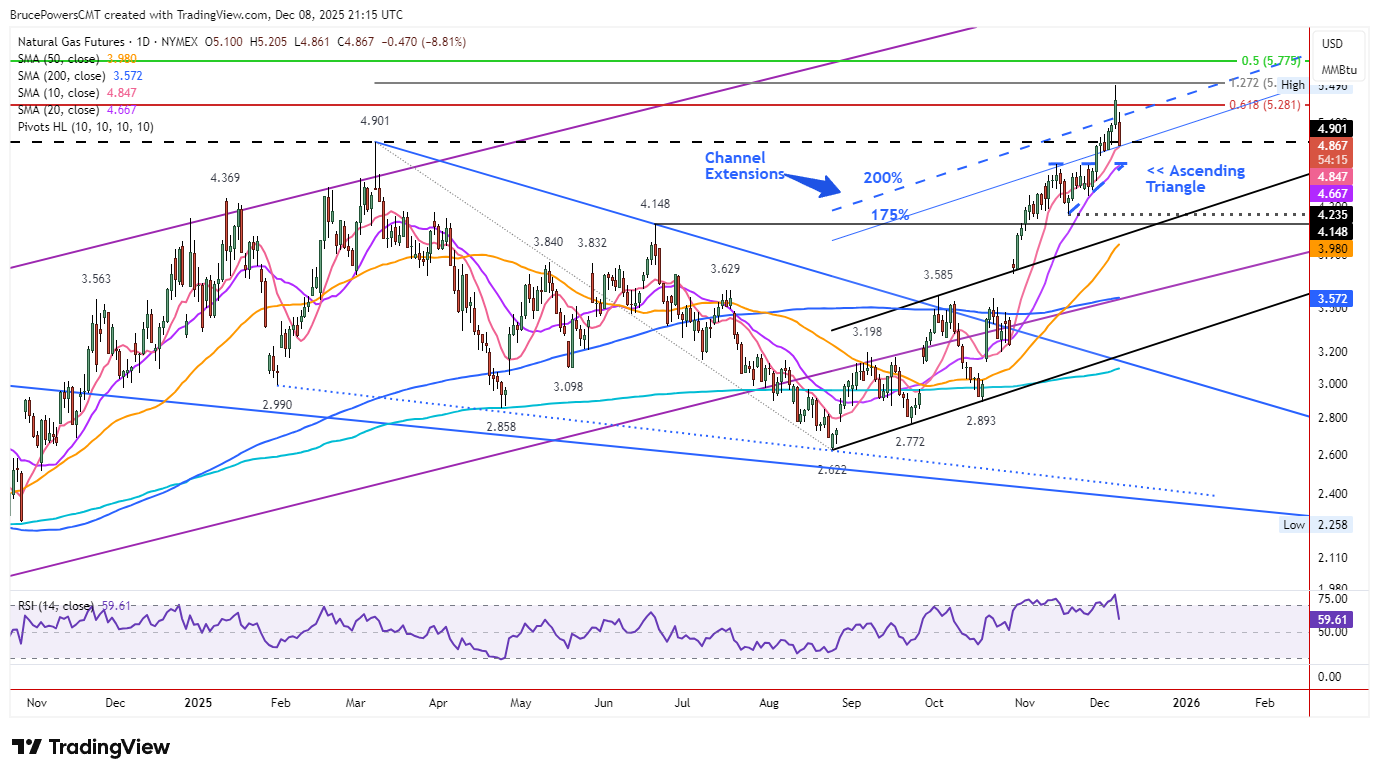
Natural gas produced a one-day bearish reversal Monday, rejecting Friday’s $5.50 parabolic extreme with conviction. Sellers remain firmly in control at writing, pinning price near the session low of $4.89 while the lower daily high at $5.21 completed a retest of the 200% top channel extension as fresh resistance—classic bearish behavior that often precedes at least a multi-day or multi-week correction.
Immediate Support Confluence
The first meaningful buyer defense sits at the rising 10-day average ($4.85) perfectly aligned with the 175% channel extension that has flipped from support to potential resistance. But given the sustained selling seen today, it looks like it may not hold. The channel extension capped the November $4.69 high, anchored three daily lows last week, and underpinned the November 28 ascending triangle breakout—making the upcoming reaction highly consequential.
Critical 20-Day Zone Below
A break of the 10-day/175% cluster quickly targets the $4.69–$4.67 zone where the triangle breakout level meets the 20-day average. The 20-day line proved itself as the springboard for the most recent leg higher when bulls aggressively defended it in late-November; another successful stand there would likely cap downside and reload the trend.
Deeper Reversal Triggers
Sustained trade under the 20-day average would signal real trend weakening, exposing lower swing lows at $4.39 (late-November) and the pivotal mid-November higher low at $4.24. Violation of $4.24 destroys the higher-low sequence and flips the short-term structure bearish.
Weekly Framework
The broader weekly pattern of higher highs and lows since October remains intact for now, lending extra significance to last week’s $4.76 low. A drop beneath that level would generate the first weekly reversal in months and dramatically shift larger-timeframe momentum.
Natural Gas Price Forecast
Every new Natural Gas analysis as it publishes, today's technical signal and key levels, live price — on one page.
See all Natural Gas forecastsOutlook
Monday’s sharp reversal has placed the parabolic advance on high alert. Aggressive defense of the 10-day/175% confluence followed by the 20-day zone would frame any weakness as a normal pullback within a still-healthy uptrend; decisive failures—particularly below $4.24 or last week’s $4.76 weekly low—open risk of a far deeper correction and possible trend failure.
For a look at all of today’s economic events, check out our economic calendar.