
Advertisement
Advertisement
Nearby Crude Oil Monthly Technical Analysis for November 2015
By:
January Crude Oil closed at $47.27, up $1.11, or 2.40%. The market posted an outside move during the month, indicating investor indecision. Crude oil has
January Crude Oil closed at $47.27, up $1.11, or 2.40%. The market posted an outside move during the month, indicating investor indecision. Crude oil has been in a holding pattern since reaching a low in September. Helping to put a lid on any rallies is the huge supply glut. Helping to underpin the market is the continual drop in the number of oil rigs. The market could remain in a range this month because of the OPEC meeting on December 1. Traders may be reluctant to take a position in either direction until they know what the cartel is going to do about its excess production.
U.S. Energy Information Administration Crude Oil Inventories
Week-Ending
October 2: 3.1 M
October 9: 7.6 M
October 16: 8.0 M
October 23: 3.4 M
Total supply remained around 480.0 million barrels, putting it near an 80-year high.
OPEC also continued to produce about 2 million barrels above demand.
U.S. Rig Count (Data made available by Baker Hughes)
September 25: 640
October 2: 614
October 9: 605
October 16: 595
October 23: 594
October 30: 578
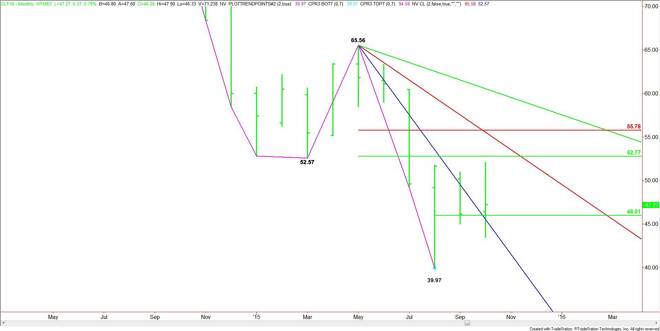
Technically, the main trend is down according to the monthly swing chart. The main range is $65.56 to $39.97. Its retracement zone is $52.77 to $55.78.
The short-term range is $39.97 to $52.05. Its pivot or 50% level is $46.01. The market straddled this level for the second month before closing above it. Trader reaction to this level is likely to control the direction of the market this month.
A sustained move over $46.01 will signal the presence of buyers. If aggressive buyers continue to come in to support the market then crude oil may test the main 50% level at $52.77. This is followed by a steep downtrending angle at $53.56 and a Fibonacci level at $55.78.
A sustained move under $46.01 will indicate the presence of sellers. However, don’t look for the start of a steep decline unless the market crosses to the weak side of a downtrending angle at $41.56.
Look for a sideways trade this month. Sellers should continue to come in on rallies because of the supply glut. Buyers are likely to support the market on dips because the drop in the rig count could lead to further cuts in U.S. production.
About the Author
James Hyerczykauthor
James Hyerczyk is a U.S. based seasoned technical analyst and educator with over 40 years of experience in market analysis and trading, specializing in chart patterns and price movement. He is the author of two books on technical analysis and has a background in both futures and stock markets.


Advertisement