
Advertisement
Advertisement
Nearby Gold Monthly Technical Analysis for November 2014
By:
Nearby Comex Gold futures broke through a pair of multi-year bottoms at $1183.80 and 1182.30 last month, driving the market into prices not seen since
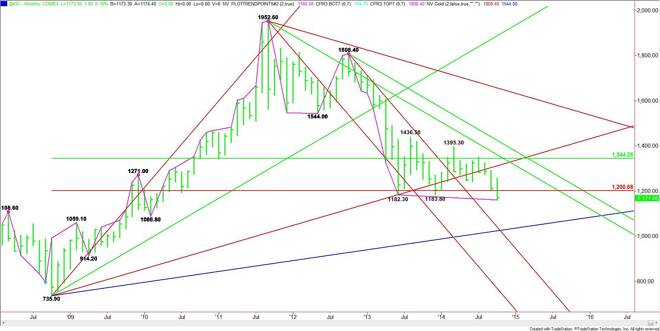
Nearby Comex Gold futures broke through a pair of multi-year bottoms at $1183.80 and 1182.30 last month, driving the market into prices not seen since March 2010. As it has been since July, the strong U.S. Dollar has been the catalyst behind the selling pressure in gold.
The main range is the October 2008 bottom at $735.90 to the September 2011 top at $1952.60. For eighteen months, its retracement zone at $1344.30 to $1200.70 served as major support. During this time period, the market moved in close to a $144.00 range. In October, the market broke through the lower or Fibonacci level at $1200.70 and close below it for the first time. This gives gold a downside bias in November.
The old support is the new resistance at $1200.70. Although there may be a few short-covering rallies, longer-term traders should note that it is going to take several months of consolidation and a breakout over the 50% level at $1344.30 and a pair of downtrending angles at $1344.60 and $1418.40 before once can say the trend has turned to up.
The monthly chart indicates there is plenty of room to the downside. The first target is February 2010 bottom at $1086.80, followed by the uptrending angle at $1027.90. Downside momentum will determine how quickly the market reaches these levels.
About the Author
James Hyerczykauthor
James Hyerczyk is a U.S. based seasoned technical analyst and educator with over 40 years of experience in market analysis and trading, specializing in chart patterns and price movement. He is the author of two books on technical analysis and has a background in both futures and stock markets.


Advertisement