
Advertisement
Advertisement
Nearby Natural Gas Monthly Technical Analysis for August 2015
By:
Nearby Natural Gas futures finished lower in July after posting an inside range. This chart pattern indicates a downside bias, but it also implies
Nearby Natural Gas futures finished lower in July after posting an inside range. This chart pattern indicates a downside bias, but it also implies impending volatility.
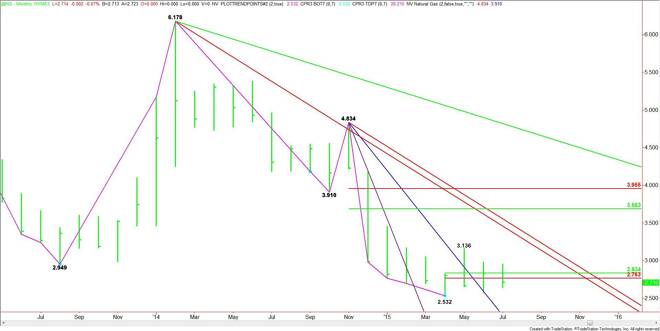
The main trend is down according to the monthly swing chart. The main range is 4.834 to 2.532. Its retracement zone and primary upside target is 3.683 to 3.955. This target is likely to remain intact for a long time since there isn’t anything in the fundamentals to suggest any possibility this zone will be tested over the near-term.
The short-term range is 2.532 to 3.136. Its retracement zone at 2.834 to 2.763 has acted like a pivot the last two months. The direction of the market in August will be determined by trader reaction to this zone. Since it closed below the zone in July, we’re going to be looking for an early downside bias in August.
Fundamentally, oversupply concerns continue to be the main driving force behind the selling pressure. The month ended with the market down five out of ten sessions. Natural gas prices begin the month down about 3.0 percent for the year.
It’s difficult to find a bullish piece of fundamental news anywhere. Most of the short-term rallies this year have been capped and have most likely been related to position-squaring or profit-taking rather than a shift in the supply/demand fundamentals.
At the start of the month, natural gas stocks are 25% more than the level of 2,294 bcf last year. There is also 3.0% more gas in storage than the five-year average of 2,795 bcf. At the end of July, natural gas stocks had also risen for 17 consecutive weeks.
Weather hasn’t been an issue all summer and conditions are likely to change in August. There may be some temperature spikes, but they shouldn’t be long enough to trigger a change in trend on the monthly chart. They will most likely create fresh shorting opportunities. Don’t expect any prolonged rallies until there is a prolonged drop in production.
From a technical perspective, use the 50% level at 2.834 as your reference. Look for an upside bias to develop on a sustained move over this level. Look for a bearish tone this month as long as the market remains under the Fibonacci level at 2.763.
About the Author
James Hyerczykauthor
James Hyerczyk is a U.S. based seasoned technical analyst and educator with over 40 years of experience in market analysis and trading, specializing in chart patterns and price movement. He is the author of two books on technical analysis and has a background in both futures and stock markets.


Advertisement