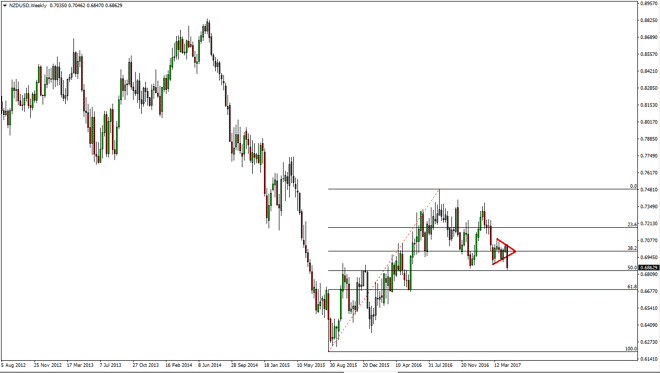
The NZD/USD pair broke down significantly during the week, slicing through the symmetrical triangle that we had been in for some time. The 50% Fibonacci
The NZD/USD pair broke down significantly during the week, slicing through the symmetrical triangle that we had been in for some time. The 50% Fibonacci retracement level is offering support, and is an area where we had seen quite a bit of noise in 2015. Because of this, I think longer-term trading is going to be difficult, but I think short-term traders may try to play a little bit of a bounce. If we break down from here, I think the 61.8% Fibonacci retracement level near the 0.67 handle will be the next target if we do breakdown.
Chris is a proprietary trader with more than 20 years of experience across various markets, including currencies, indices and commodities. As a senior analyst at FXEmpire since the website’s early days, he offers readers advanced market perspectives to navigate today’s financial landscape with confidence.