



The dollar is once again showing technical weakness, while metals are splitting into two camps: some continue to hold inside consolidation, while others are now standing right at the edge of a larger directional move, which makes today’s closing levels especially important.
The U.S. Dollar Index (DX.F)
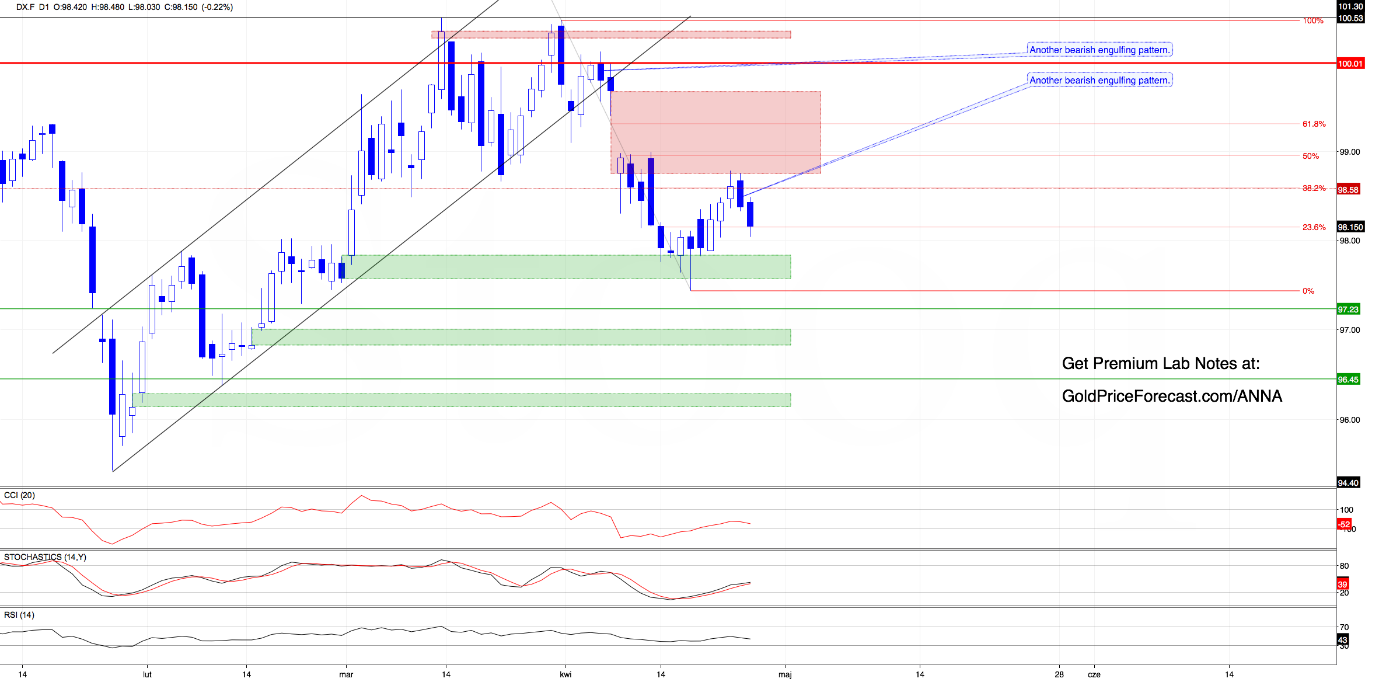
The first thing that stands out on the daily chart is Friday’s black candle.
Not only did it erase the small bullish gap created at the start of the day, but it also closed Thursday’s bullish gap and together, with the preceding white candle, formed another bearish engulfing pattern.
That matters because a very similar candlestick formation marked the beginning of the April selloff. When we add to this two more factors (two bullish gaps have been neutralized and the earlier breakout above the 38.2% Fibonacci retracement has been invalidated) we see that the technical picture turns noticeably weaker.
Today’s session only reinforced that view, with the dollar extending lower and slipping back below 99, which increases the probability of a renewed test of the key support zone at 97.56-97.82 in the coming days.
Key Levels to Watch:
Supports: 97.56-97.82 (green support zone) / 97.36
Resistances: 98.75-99.68 / 100
Copper Price Forecast
Every new Copper analysis as it publishes, today's technical signal and key levels, live price — on one page.
See all Copper forecastsCopper (HG.F)
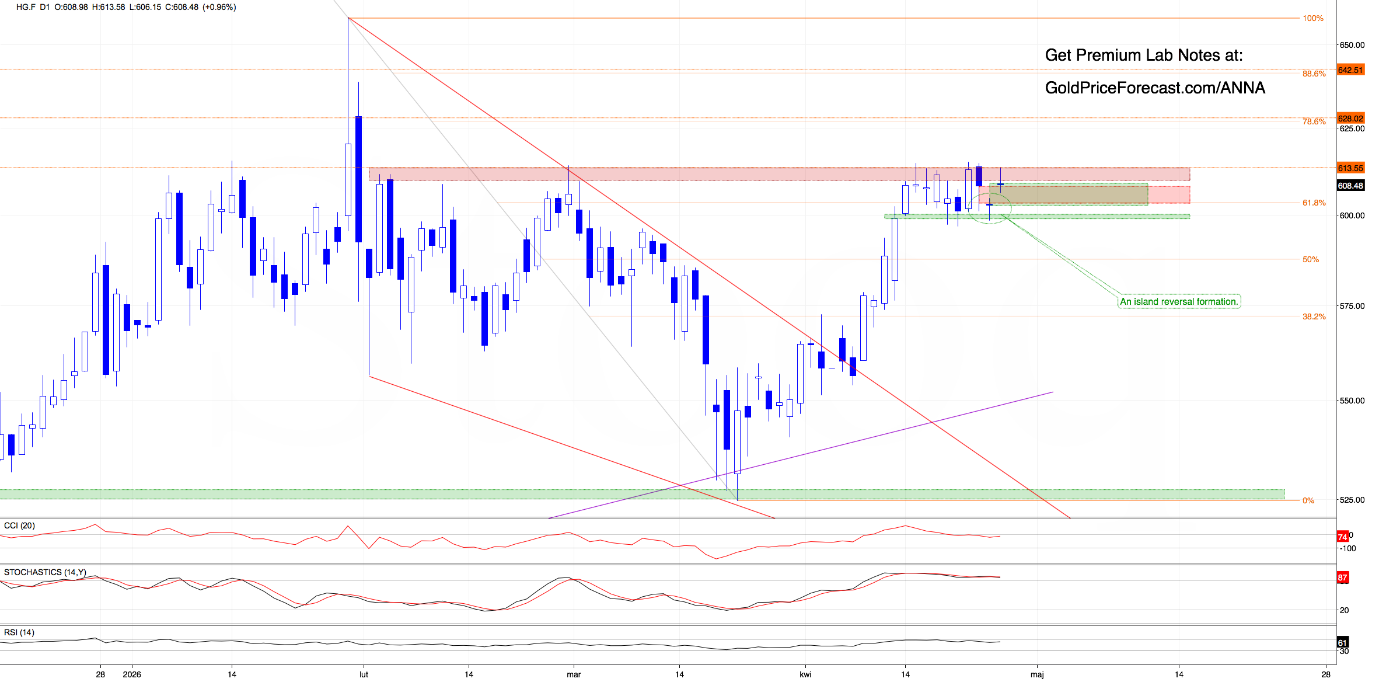
Copper is showing one of the more interesting technical setups on the board.
Friday’s bearish gap triggered yet another retest of the key green support zone, but instead of breaking lower, that support held, and today’s bullish gap immediately launched an attack on the nearest key resistance.
That sequence created a classic bullish island reversal pattern on the chart, which matters because island reversals often act as short-term sentiment reset points (in practical terms, the nearest support zone just got stronger, and bulls have gained another technical argument).
Still, our last comment remains valid:
“(…) For bears, the condition is clear: no deeper correction without a confirmed break of support.
For bulls: no continuation without clearing resistance.
Therefore, until one side wins, price remains compressed and the next breakout/breakdown will likely define the next meaningful move. (…)”
Key Levels to Watch:
Supports: key green support zone (599.05-600.35)
Resistances: 608.50-613.75 / 628 / 642.50
Platinum (PL.F)
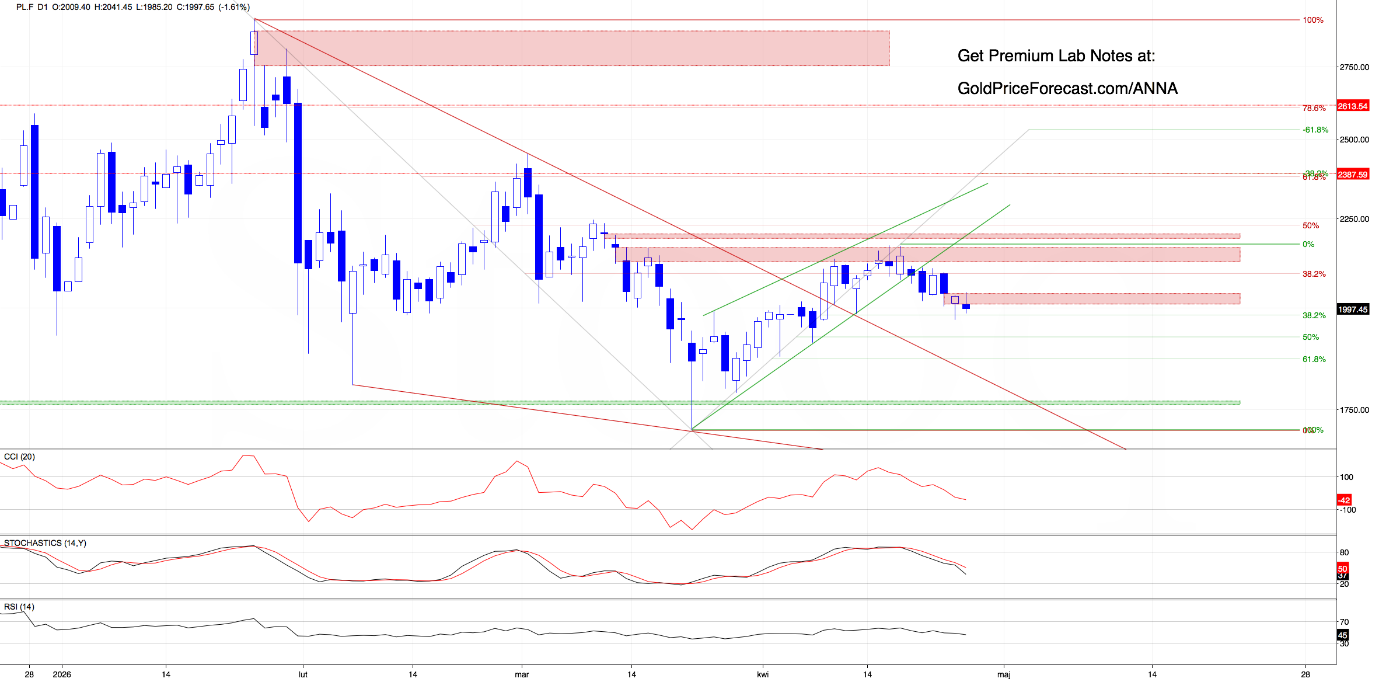
Platinum continues to lean bearish.
Friday opened with a bearish gap (2011-2038) that remains unfilled despite buyers’ attempts, which means that area still acts as immediate resistance and that alone already gives sellers an edge.
But there’s more… price also continues to trade below the lower boundary of the green rising wedge, which means the bearish scenario triggered by the breakdown under the formation remains fully active.
Therefore, as long as bulls fail to close that gap and reclaim the wedge, sellers retain control.
Palladium (PA.F)
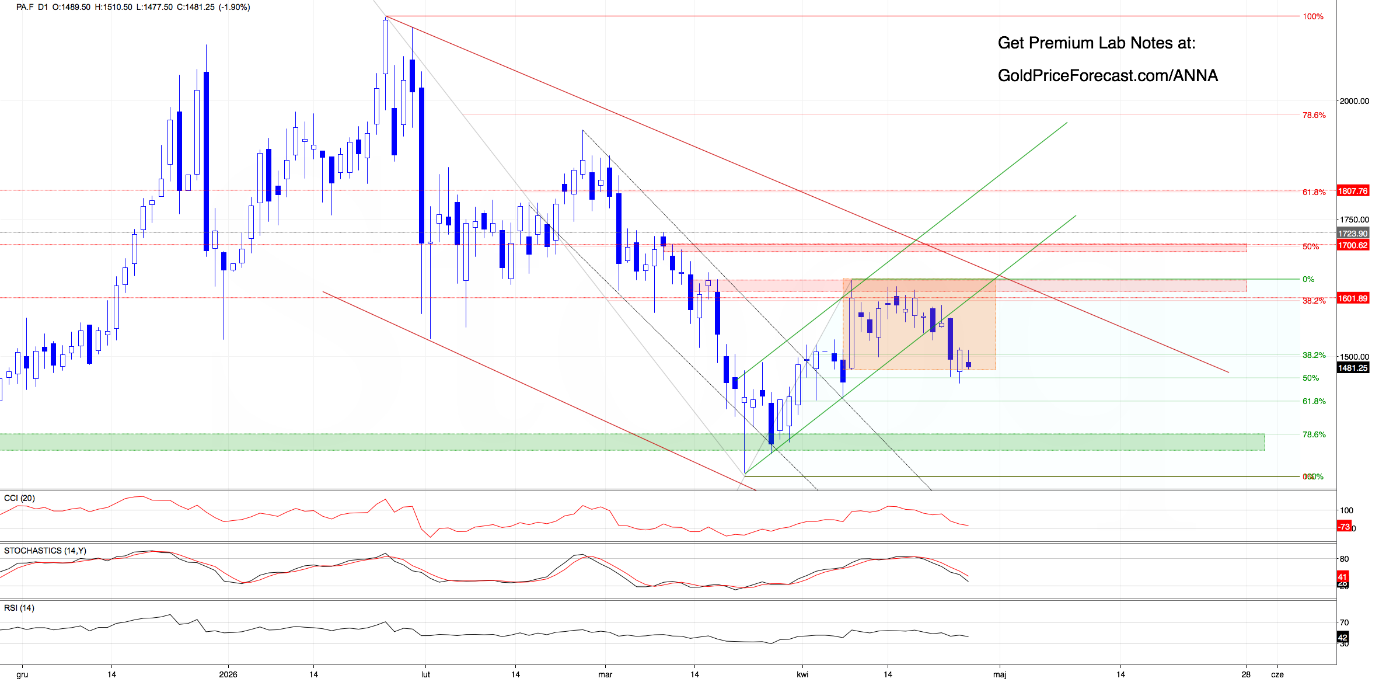
Palladium is sitting in a much more delicate balance.
Despite Friday’s bearish gap and a temporary drop below the lower boundary of the orange consolidation, buyers managed to stage a successful late-session counterattack, which invalidated the earlier breakdown and fully closed the morning Asian gap.
This price action showed exactly where buyers are still willing to defend.
However, the new week opened with another small bearish gap (1489-1509), and bulls have not been able to close it yet, which raises the risk of another pressure test around the lower boundary of the consolidation.
Today’s Takeaway
Dollar
Bullish scenario: reclaiming 99 and stabilizing above recent resistance would slow bearish pressure.
Bearish scenario: continued weakness below 99 keeps the path open toward 97.56-97.82.
Key takeaway: bearish engulfing + failed breakout is not the combo bulls wanted to see.
Copper
Bullish scenario: island reversal supports another upside attempt if bulls maintain momentum.
Bearish scenario: failure to follow through keeps the broader range intact.
Key takeaway: strong technical reaction, but confirmation is still needed.
Final Thought: The week is starting with pressure in all the right places. Not every chart is ready to break but several are getting uncomfortably close. Today’s closing price may show the winner.
The line in the sand is clear: → the rest of the analysis is available to Premium readers today.
Stay patient, respect the levels, and let the market show its hand.
Anna