DOGE and SHIB were on the move this morning, with anticipation of the Shibarium upgrade and Elon Musk support delivering weekend support.
Dogecoin (DOGE) rose by 0.92% on Saturday. Following a 0.69% gain on Friday, DOGE ended the day at $0.0880.
A bullish start to the day saw DOGE rally to a mid-morning high of $0.0939 before hitting reverse. DOGE broke through the First Major Resistance Level (R1) at $0.0889 and the Second Major Resistance Level (R2) at $0.0906.
The reversal saw DOGE slide to an early afternoon low of $0.0868. However, steering clear of the First Major Support Level (S1) at $0.0847, DOGE bounced back to end the day at $0.0880.
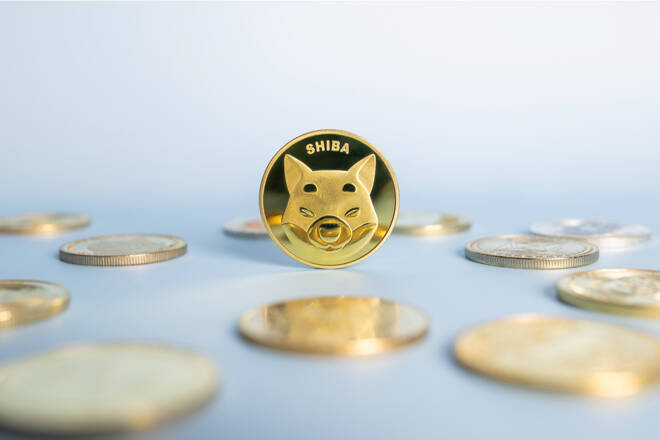
Shiba inu coin (SHIB) rose by 0.77% on Saturday. Following a 0.95% gain on Friday, SHIB ended the day at $0.00001182.
Tracking the broader market, SHIB rallied to a mid-morning high of $0.00001231 before hitting reverse. SHIB broke through the First Major Resistance Level (R1) at $0.00001197 and the Second Major Resistance Level (R2) at $0.00001222.
However, the reversal saw SHIB slide to a late low of $0.00001165. Steering clear of the First Major Support Level (S1) at $0.00001139, SHIB recovered to end the session at $0.00001182.
There were no Shibarium updates on Saturday to support a bullish SHIB session. However, increased whale appetite continued to send bullish signals, with investors expecting the Shibarium upgrade to have a material price impact.
According to WhaleStats, the top 100 ETH whales held $597,571,508 SHIB on Saturday, placing it at the top of the hodling table. WhaleStats also stated that SHIB flipped CHZ for the most traded token among the top 100 ETH whales.
The increased activity comes ahead of the Shibarium upgrade as investors wait for further details from the Shibarium Network.
DOGE made gains despite a lack of updates from the Dogecoin Foundation. However, news of Elon Musk pushing for McDonald’s (MCD) to accept DOGE delivered support. This week, Elon Musk, “Mr. Tweet,” announced,
“I will eat a happy meal on tv if McDonald’s accepts Dogecoin.”
There was interaction between McDonald’s and Musk on Twitter on Friday. After an extended period of silence, investors took the tweets as Musk’s continued support for DOGE.
Today, investors need to continue monitoring the crypto news wires for updates on Shibarium and Twitter. However, a lack of updates would leave the pair in the hands of the broader crypto market. The NASDAQ mini could influence the mood in the final hour as investors turn toward Wednesday’s Fed interest rate decision.
At the time of writing, DOGE was up 0.45% to $0.0884. A bullish start to the day saw DOGE rise from an early low of $0.0873 to a high of $0.0898.
DOGE needs to move through the $0.0896 pivot to target the First Major Resistance Level (R1) at $0.0923 and the Saturday high of $0.0939. A return to $0.0900 would signal a bullish DOGE session. However, the crypto news wires and network updates need to be DOGE-friendly to support a breakout session.
In the event of an extended rally, the Second Major Resistance Level (R2) at $0.0967 would likely come into play. The Third Major Resistance Level (R3) sits at $0.1038.
Failure to move through the pivot would leave the First Major Support Level (S1) at $0.0852 in play. However, barring another extended sell-off, DOGE should avoid sub-$0.0850 and the Second Major Support Level (S2) at $0.0825. The Third Major Support Level (S3) sits at $0.0754.
The EMAs sent a bullish signal, with DOGE sitting above the 50-day EMA, currently at $0.0864. This morning, the 50-day EMA moved away from the 100-day EMA, with the 100-day EMA widening from the 200-day EMA. The price signals were bullish.
A hold above the 50-day EMA ($0.0864) would support a move through R1 ($0.0923) to bring R2 ($0.0967) into view. However, a fall through the 50-day ($0.0864) would support a slide through S1 ($0.0852) to give the bears a run at the 100-day EMA ($0.0845) and S2 ($0.0825). A fall through the 50-day EMA would deliver a bearish signal.
At the time of writing, SHIB was up 0.59% to $0.00001189. A mixed start to the day saw SHIB fall to an early low of $0.00001173 before rising to a high of $0.00001204.
SHIB needs to move through the $0.00001193 pivot to target the First Major Resistance Level (R1) at $0.00001220 and the Saturday high of $0.00001231. A move through the morning high of $0.00001204 would signal an extended bullish session. However, SHIB would need more details on the Shibarium upgrade and broader market support to deliver a breakout session.
In the event of an extended rally, SHIB could test the Second Major Resistance Level (R2) at $0.00001259. The Third Major Resistance Level (R3) sits at $0.00001325.
Failure to move through the pivot would leave the First Major Support Level (S1) at $0.00001154 in play. However, barring another extended sell-off, SHIB should avoid sub-$0.00001100. The Second Major Support Level (S2) at $0.00001127 should limit the downside.
The Third Major Support Level (S3) sits at $0.00001061.
The EMAs send a bullish signal, with SHIB sitting above the 50-day EMA, currently at $0.00001162. The 50-day EMA moved away from the 100-day EMA, with the 100-day EMA widening from the 200-day EMA. The signals were bullish.
A hold above the 50-day EMA ($0.00001162) would support a breakout from R1 ($0.00001220) to target R2 ($0.00001259). However, a fall through the 50-day EMA ($0.00001162) would support a slide through S1 ($0.00001154) to give the bears a run at S2 ($0.00001127) and the 100-day EMA ($0.00001114). A fall through the 50-day would send a bearish signal.
With over 28 years of experience in the financial industry, Bob has worked with various global rating agencies and multinational banks. Currently he is covering currencies, commodities, alternative asset classes and global equities, focusing mostly on European and Asian markets.