


Spot Silver Loses Ground for Third Straight Week as Rate Trade Tightens Its Grip
Spot Silver (XAGUSD) closed the week ending May 29 at $75.29, down $0.23, or 0.31%. That number tells you nothing. The $71.79 to $78.83 range tells you everything. Traders got whipped in both directions as rate expectations shifted, Iran headlines crossed, and the supply deficit caught every dip before it could stick. Three weeks lower in a row now, and the main trend is still down.
Weekly Spot Silver (XAGUSD) Technical Analysis
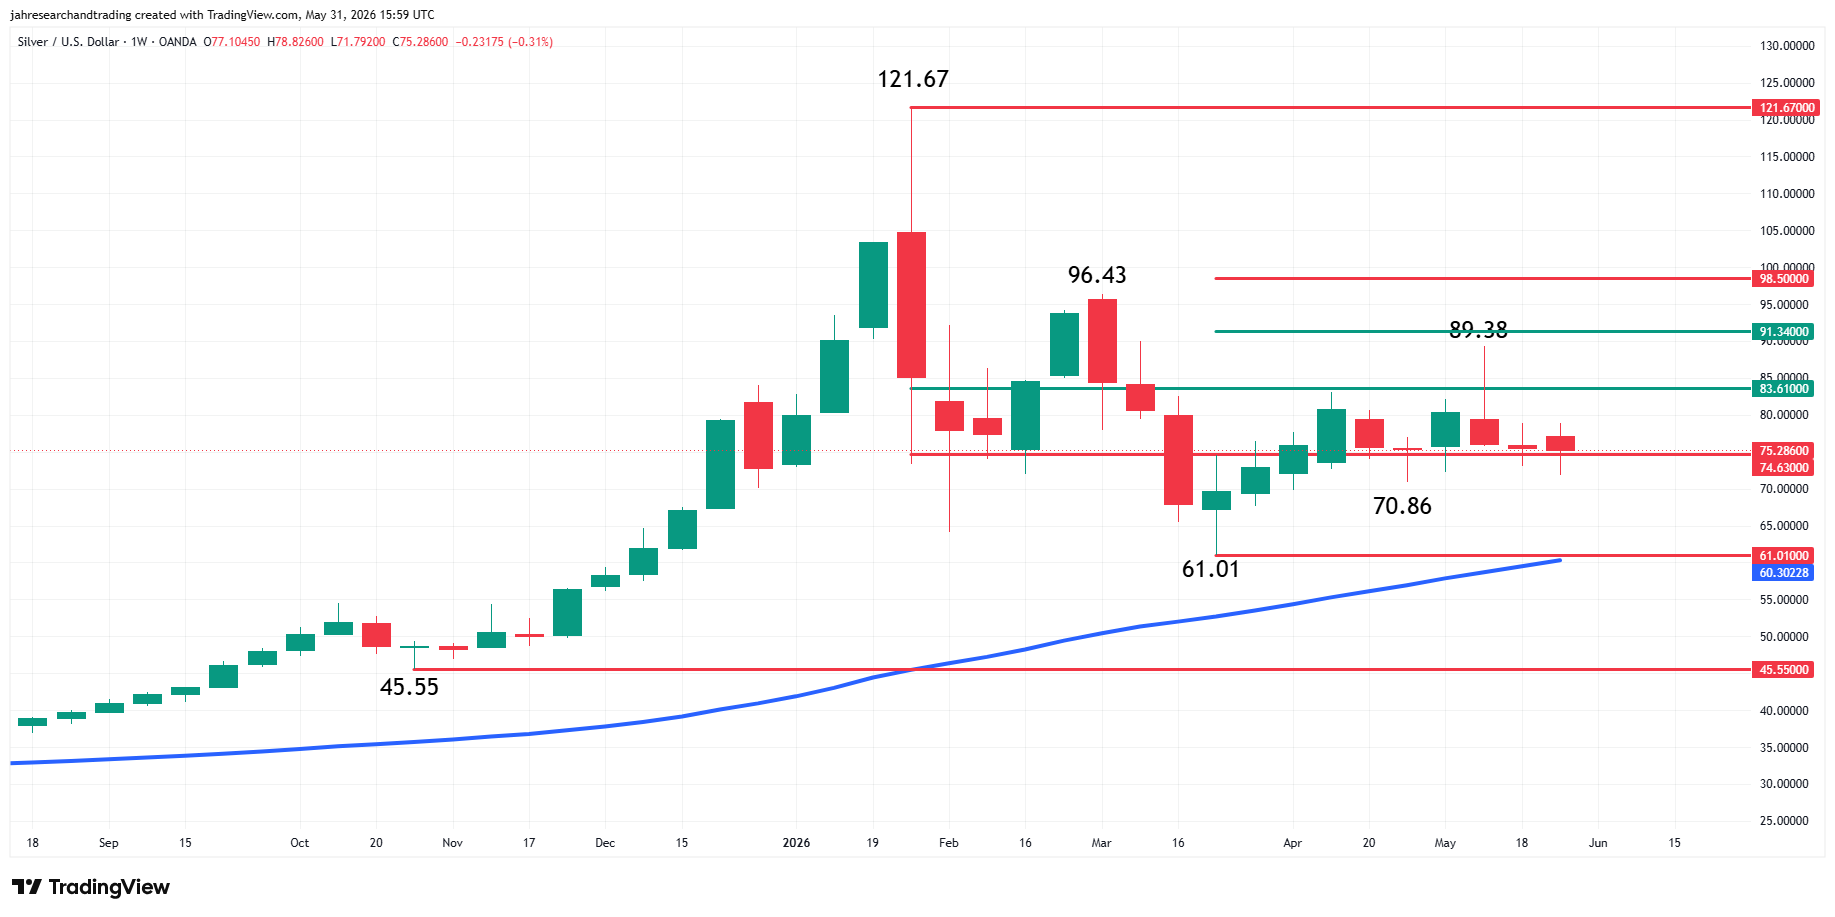
Spot Silver (XAGUSD) finished lower for the third straight week on May 29. This is not a surprise since the main trend is down. A trade through $89.38 will change the main trend to up. Taking out $61.01 will reaffirm the downtrend.
The minor trend is up, which is controlling the current momentum. A trade through $70.86 changes the minor trend to down and shifts momentum to the downside.
The 52-week moving average at $60.30 remains the best support for longer-term traders.
The long-term range is $45.55 to $121.67. The market has been straddling its retracement zone at $83.61 to $74.63 since mid-March. This could be a sign of accumulation.
The intermediate range is $121.67 to $61.01. Its retracement zone at $91.34 to $98.50 is resistance and a potential trigger point for an upside breakout.
It’s clear to me from the weekly swing chart that the direction of XAGUSD the week-ending June 5 will be determined by trader reaction to the 61.8% level at $74.63.
A sustained move over $74.63 will indicate the presence of buyers. If this creates enough upside momentum then look for a surge into $83.61. Traders will once again assess the fundamentals at this point because this level could be resistance or a trigger point for an acceleration into $91.34 to $98.50.
We’re also going to be watching to see if traders are bidding or taking out offers. This will help us evaluate the strength of the momentum. Are we seeing breakout conditions or will it be a grinder?
The downside is a little different. It’s a little more open. A sustained move under $74.63 will indicate the presence of sellers. The first target is the minor swing bottom at $70.86. If this price fails, we could see a steep break into the support cluster formed by the mid-March bottom at $61.01 and the 52-week moving average at $60.30.
Silver Price Forecast
Every new Silver analysis as it publishes, today's technical signal and key levels, live price — on one page.
See all Silver forecastsWhy Did Rates Control This?
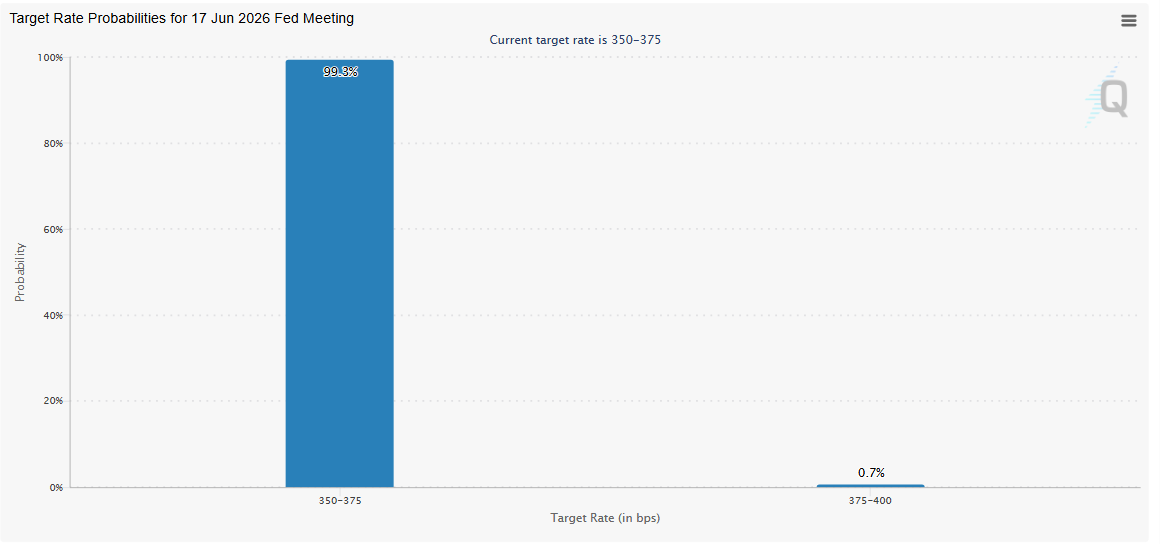
The rate trade ran the entire week. Inflation data and rising energy costs pushed Federal Reserve rate cut expectations further out and Spot Silver (XAGUSD) took the hit immediately. Silver pays no yield.
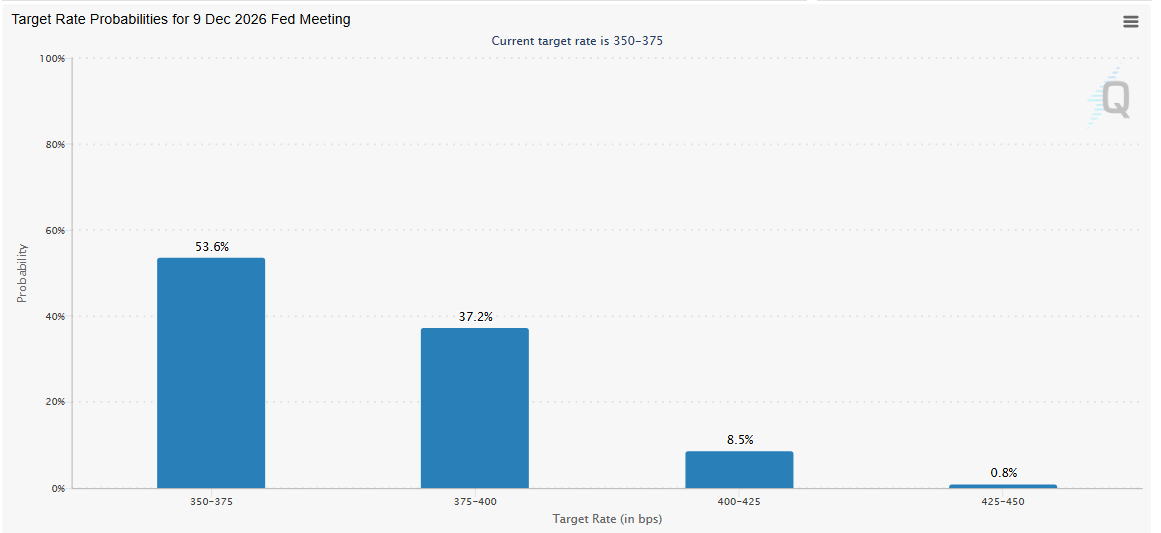
When the market prices in rates staying higher for longer, money moves to bonds and cash instruments that actually pay. The U.S. Dollar Index firmed up alongside 10-Year U.S. Treasury yields, and that combination made Spot Silver (XAGUSD) more expensive for international buyers while giving domestic money a reason to park in Treasuries instead. Every rally attempt ran straight into that wall.
Safe Haven Got It Wrong
This is the part that gets misread. Rising tensions with Iran pushed oil prices higher and the knee-jerk reaction was to buy precious metals on geopolitical risk. But that is not how this trade works right now. Higher oil means higher inflation pressure. Higher inflation pressure means the Federal Reserve stays restrictive longer. That is bearish for Spot Silver (XAGUSD), not bullish.
When reports came through later suggesting progress on easing tensions, oil pulled back and some of the inflation fear came with it. That should have helped silver. Instead it just removed the safe-haven premium without replacing it with rate cut optimism. Sellers came in from one side and buyers disappeared from the other.
Six Years of Deficits Matter
The reason Spot Silver (XAGUSD) did not break down harder is the same reason it has held up all year. This market is heading into its sixth consecutive year where global demand exceeds available supply. That deficit is structural. Industrial consumption from electronics, electrical infrastructure, and the expanding buildout of artificial intelligence data centers continues to run at historically strong levels. Some industries have found ways to use less silver per unit but total demand keeps climbing.
That kept buyers stepping in on every dip below $73 and prevented the rate-driven selling from turning into a real breakdown. Physical demand across Asia was mixed. Elevated prices and the wild swings made some consumers sit on their hands while investment demand stayed firm as buyers kept looking for protection against inflation and government debt levels that keep growing with no ceiling in sight.
Jobs Report Decides Everything
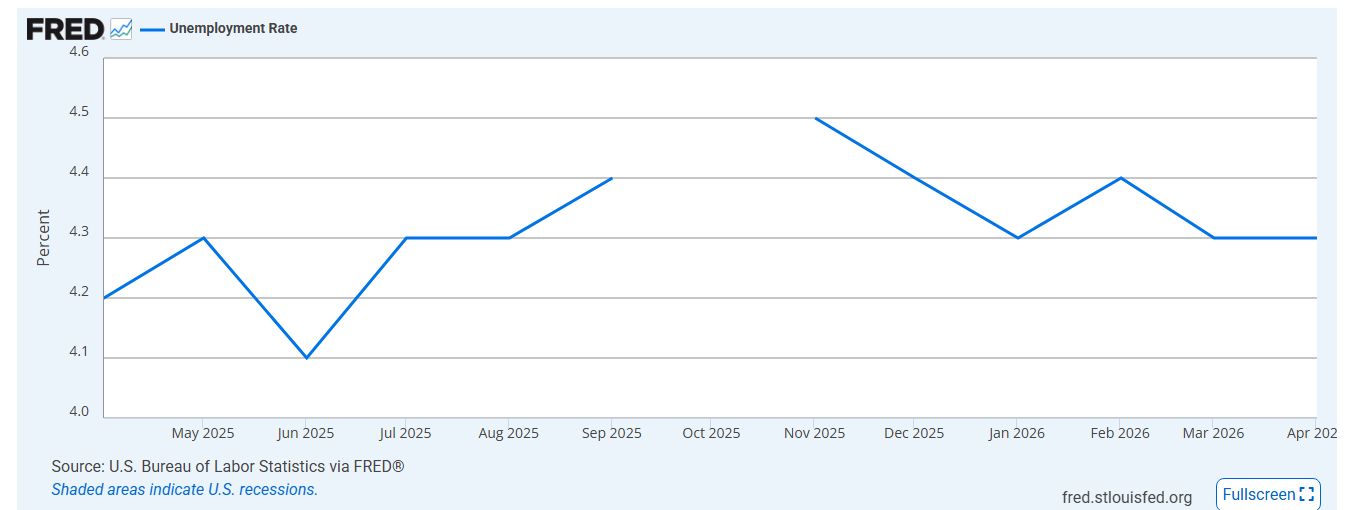
Friday’s May Employment Situation Report is the only number that matters for the week ending June 5. Non-Farm Payrolls, wage growth, and the unemployment rate all drop at once, and the reaction will set the direction for Spot Silver (XAGUSD) through the rest of June.
The rate trade has been running this market for three straight weeks. A hot jobs number does not change that story, it locks it in. The U.S. Dollar Index and 10-Year U.S. Treasury yields stay firm and sellers keep pressing.
What changes the story is a miss. Slower hiring or cooler wages would be the first real crack in the higher-for-longer case, and that is the only thing that gives buyers a reason to step back in.
The ISM Manufacturing Index on June 1 and the ISM Services Index on June 3 hit before the jobs data. Watch the prices-paid components more than the headlines. Hot readings there take rate cut expectations off the table before Friday even arrives. Cool ones set the stage for a bigger reaction if payrolls disappoint.
Weekly Outlook
The supply deficit and industrial demand are not going anywhere. That is the floor under this market. But the ceiling is being set by rate expectations and the Federal Reserve’s refusal to signal cuts while inflation data stays hot. Friday’s Employment Situation Report is the gate. A strong number keeps the ceiling in place and gives sellers confidence to press. A weak number opens a path higher because it changes the rate calculation that has been capping every rally for three straight weeks.
The level that matters most is $74.63. Spot Silver (XAGUSD) has been straddling the 61.8% retracement zone since mid-March and the reaction at that level this week tells you whether the accumulation pattern is real or the market rolls over toward $70.86 and the support cluster near $61. The way I see it, the jobs number and that one level on the chart are the only two things that matter going into the week.
More Information in our Economic Calendar.