


Key Support Zone Under Pressure
Natural gas tested a key support zone for the seventh day on Monday, while continuing to form a narrow range consolidation pattern with support at $2.80 and resistance at $2.93. Those levels are defined by last Thursday’s low and high, respectively.
The potential significance of the consolidation range as support is defined by the confluence of several indicators, including the 78.6% Fibonacci retracement at $2.82, an earlier uptrend line that was not adjusted to the new swing low in late April, and the higher swing low at $2.81 from February. This clustering of technical support levels increases the importance of the current range and raises the possibility that buyers may attempt to regain control.
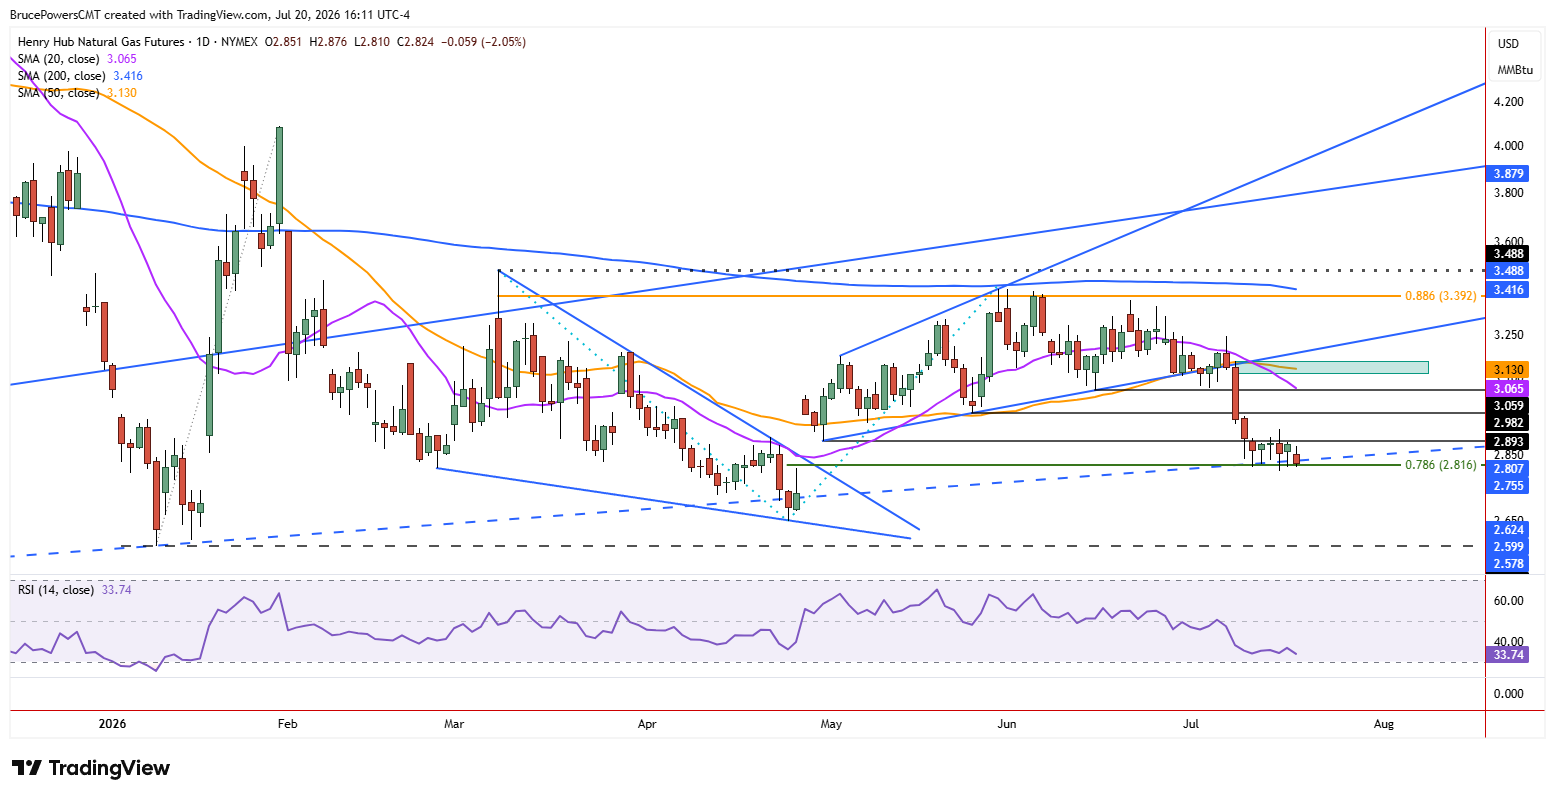
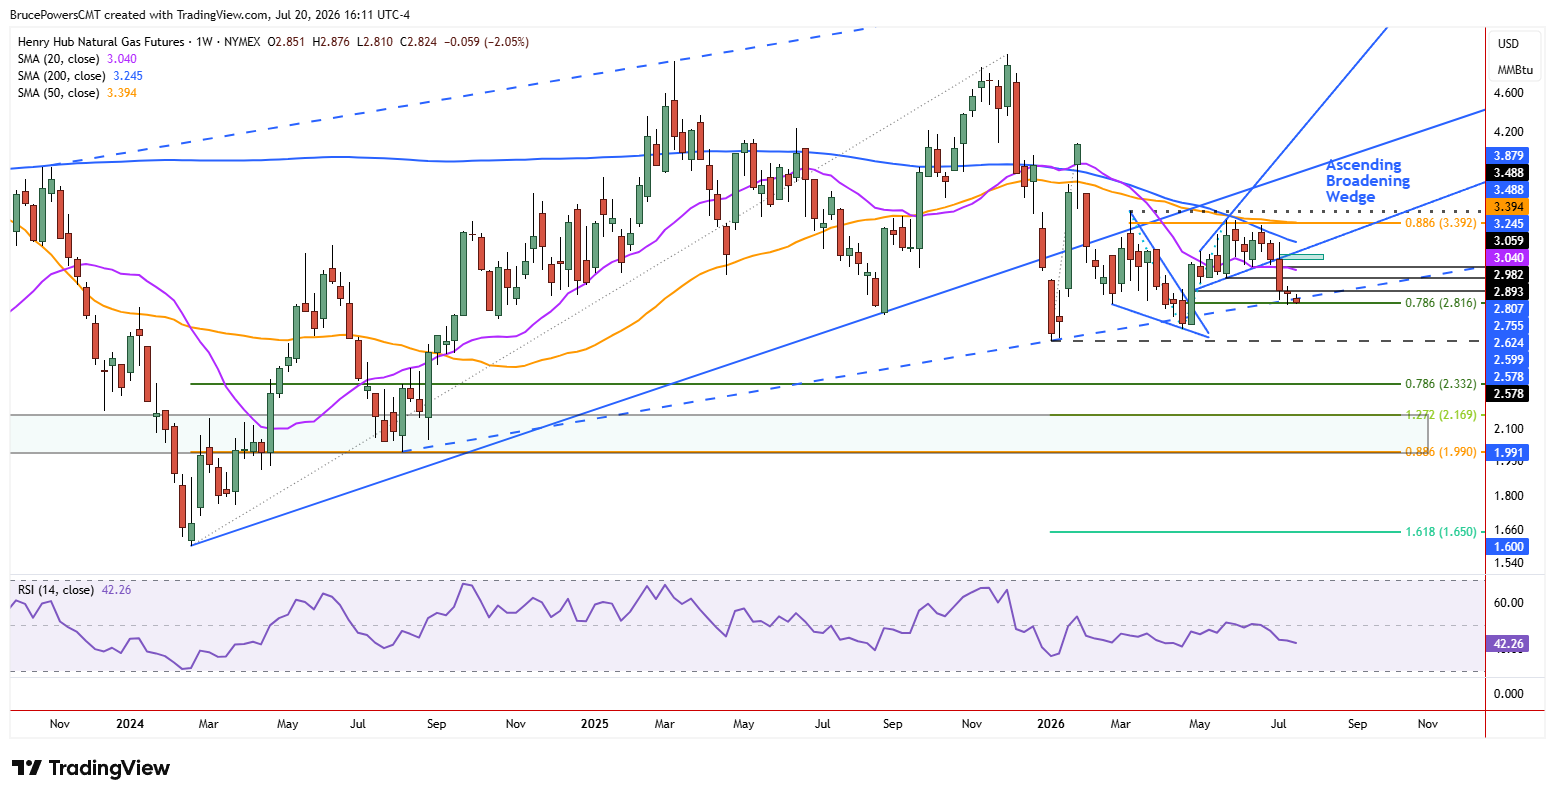
Although there has not yet been a countertrend rally from the support zone, the confluence of support indicators and the lack of downside follow-through suggest it may yet occur. A decisive rally above $2.93 would signal a one-week bullish reversal above last week’s high, which formed a relatively narrow range hammer candlestick pattern. However, additional confirmation through follow-through buying would be needed to confirm bullish momentum.

Resistance Defines the Recovery Path
Nonetheless, upside may be limited as resistance is anticipated near prior key support zones from the recent advance. Upside targets begin with the higher swing low from May at $2.98, followed by the next higher swing low at $3.06. The breakdown from a rising broadening formation triggered two weeks ago on a drop below the $3.16 price area, defined by a daily high from July 9. That area also aligns with potential dynamic resistance from the 50-day moving average, now near $3.13.
Natural Gas Price Forecast
Every new Natural Gas analysis as it publishes, today's technical signal and key levels, live price — on one page.
See all Natural Gas forecastsBroader Trend Still Faces Bearish Risks
Since the 50-day moving average was identified as key dynamic support during the prior advance, it represents the more significant potential dynamic resistance zone. A successful test of resistance near the 50-day moving average would therefore likely complete the first pullback following the breakdown from the broadening formation and set the stage for a bearish continuation of the larger developing bearish trend that recently established a new lower swing high at $3.42 in early June.
Therefore, while the current support zone may trigger a short-term rebound, the broader technical structure remains vulnerable unless natural gas can reclaim key resistance levels and reverse the recent sequence of lower highs.
If you’d like to know more about how to trade natural gas, please visit our educational area.


