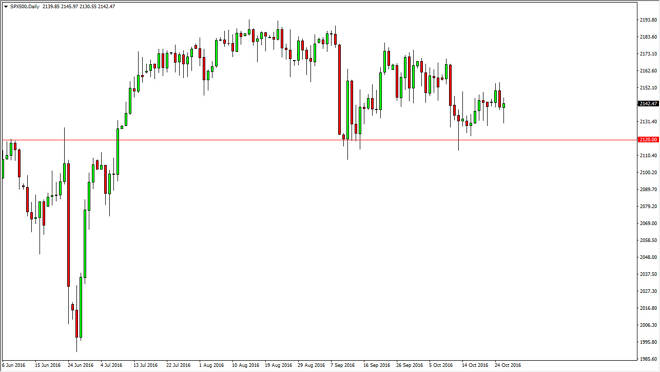
The S&P 500 fell initially during the course of the session, but bounced enough to form a bit of a hammer. The hammer of course is a bullish sign and
The S&P 500 fell initially during the course of the session, but bounced enough to form a bit of a hammer. The hammer of course is a bullish sign and I believe that given enough time we continue to go higher. The 2120 level below is massively supportive, so I think we are more than likely going to see buyers entering this market and reaching towards the 2175 handle. Ultimately, I do believe that given enough time we find buyers, so there’s no interest on my part to sell this market until we break down below when I think is the bottom of the support level, which extends all the way down to the 2100 level.
Chris is a proprietary trader with more than 20 years of experience across various markets, including currencies, indices and commodities. As a senior analyst at FXEmpire since the website’s early days, he offers readers advanced market perspectives to navigate today’s financial landscape with confidence.