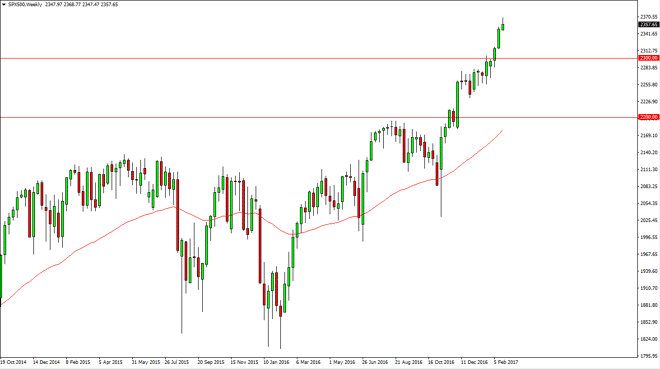
The S&P 500 tried to rally during the week, and did in fact keep some of the gains. However, looks as if we are starting to struggle a little bit with
The S&P 500 tried to rally during the week, and did in fact keep some of the gains. However, looks as if we are starting to struggle a little bit with momentum, so I feel that the market should pull back giving us an opportunity to pick up value in this market. The 2300 level underneath continues to be the “floor” as far as I can see. I believe that we do go higher, but being a bit overextended should have most traders looking for lower levels in order to get involved.
Chris is a proprietary trader with more than 20 years of experience across various markets, including currencies, indices and commodities. As a senior analyst at FXEmpire since the website’s early days, he offers readers advanced market perspectives to navigate today’s financial landscape with confidence.