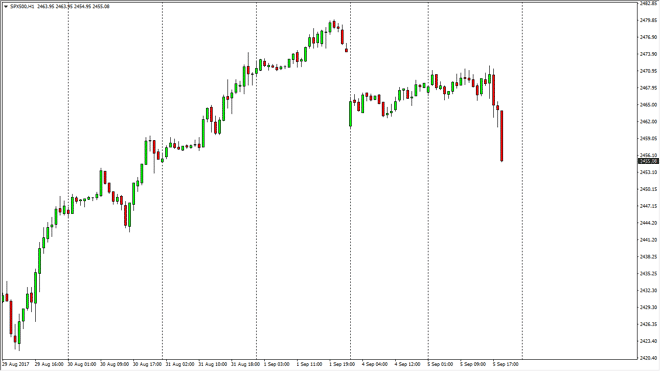
The S&P 500 initially went sideways on Tuesday, but then started to roll over rather drastically. As I record this, we are testing the 2450 handle
The S&P 500 initially went sideways on Tuesday, but then started to roll over rather drastically. As I record this, we are testing the 2450 handle underneath, and that being the case, it’s likely that we will see some attempt at support in that area. However, we have seen a significant amount of bearish pressure after the gap from Friday, and I think we are going to see a bit of a correction. Most pundits are looking for a correction, and although the algorithmic traders keep coming back to buy the market, I think that this is desperately needed and as traders come back from holiday we could see a bit of a correction. That should be a buying opportunity, but I need to see stability on a daily chart to start putting money to work. As far as shorting is concerned, I would be a bit hesitant to do so.
Chris is a proprietary trader with more than 20 years of experience across various markets, including currencies, indices and commodities. As a senior analyst at FXEmpire since the website’s early days, he offers readers advanced market perspectives to navigate today’s financial landscape with confidence.