


So, what should an investor do during such volatile times? Read on to help stay calm amid the geopolitical chaos.

A Dangerous Long-Term Strategy
It’s clear when you look at that chart, the S&P 500 (SPX) has been choppy over the last five months:
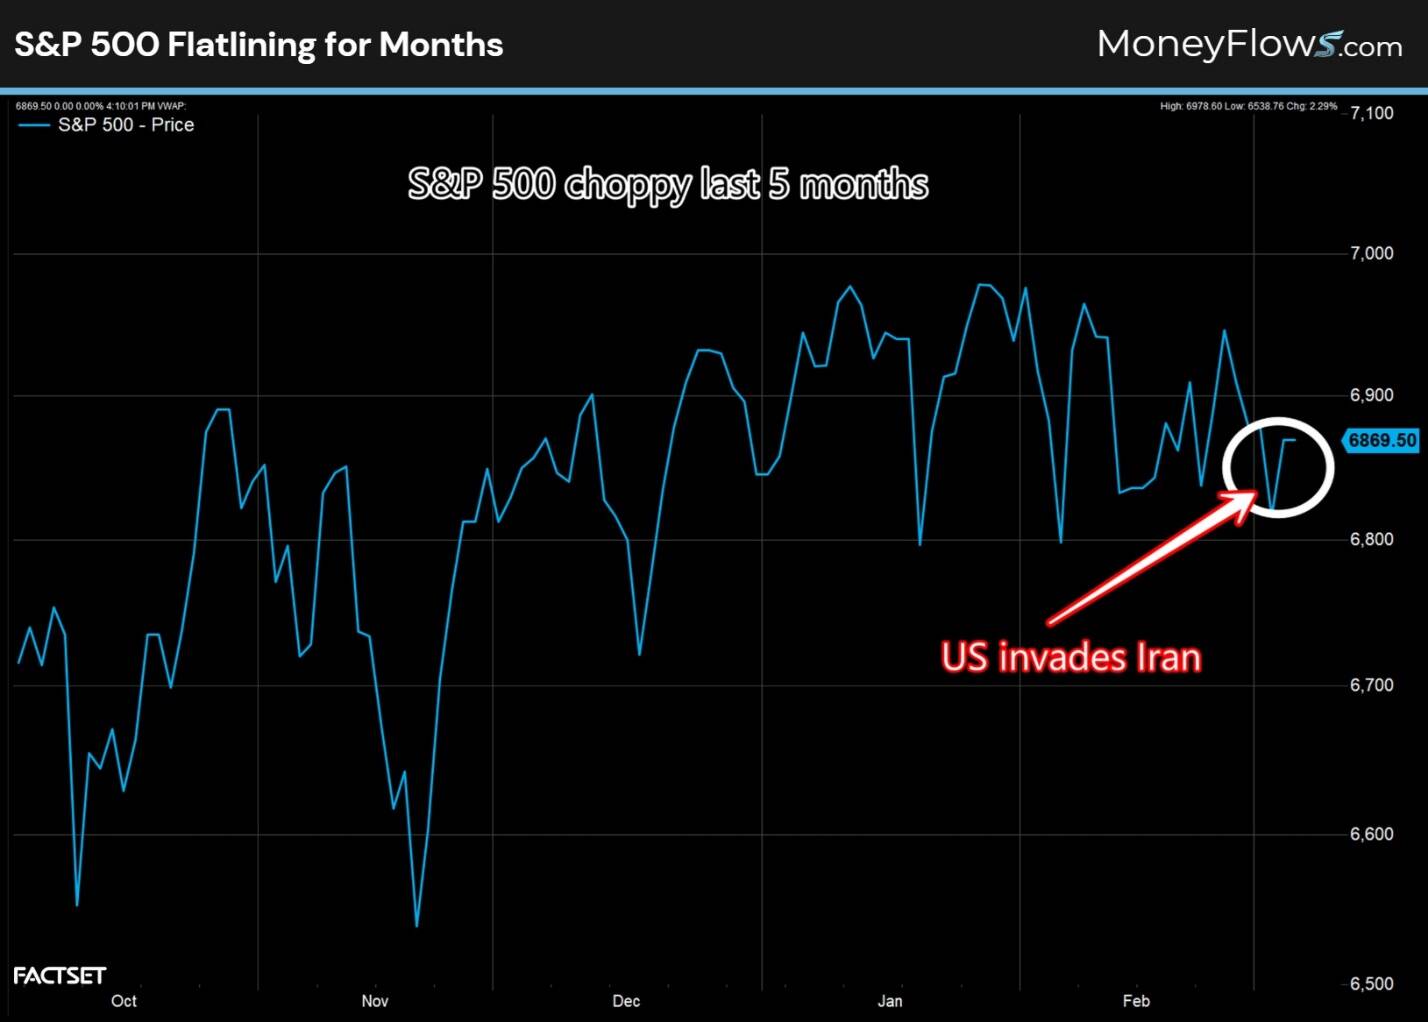
And of course, at the end of that chop is the start of a new geopolitical event.
You might think a move to cash would be safe. Why risk these ups and downs, right? You might not make much money, but at least you won’t lose it.
However, that’s a dangerous long-term strategy. Let me show you why.
After major geopolitical events have settled, history shows the S&P 500 averages positive gains that outpace holding cash. Not initially, but over time:
- One-month return: -0.4%
- Three-month return: 1.8%
- Six-month return: 6.2%
- 12-month return: 9.5%
- 24-month return: 22%
Source: FactSet
And that is true over a long arc of historical events:
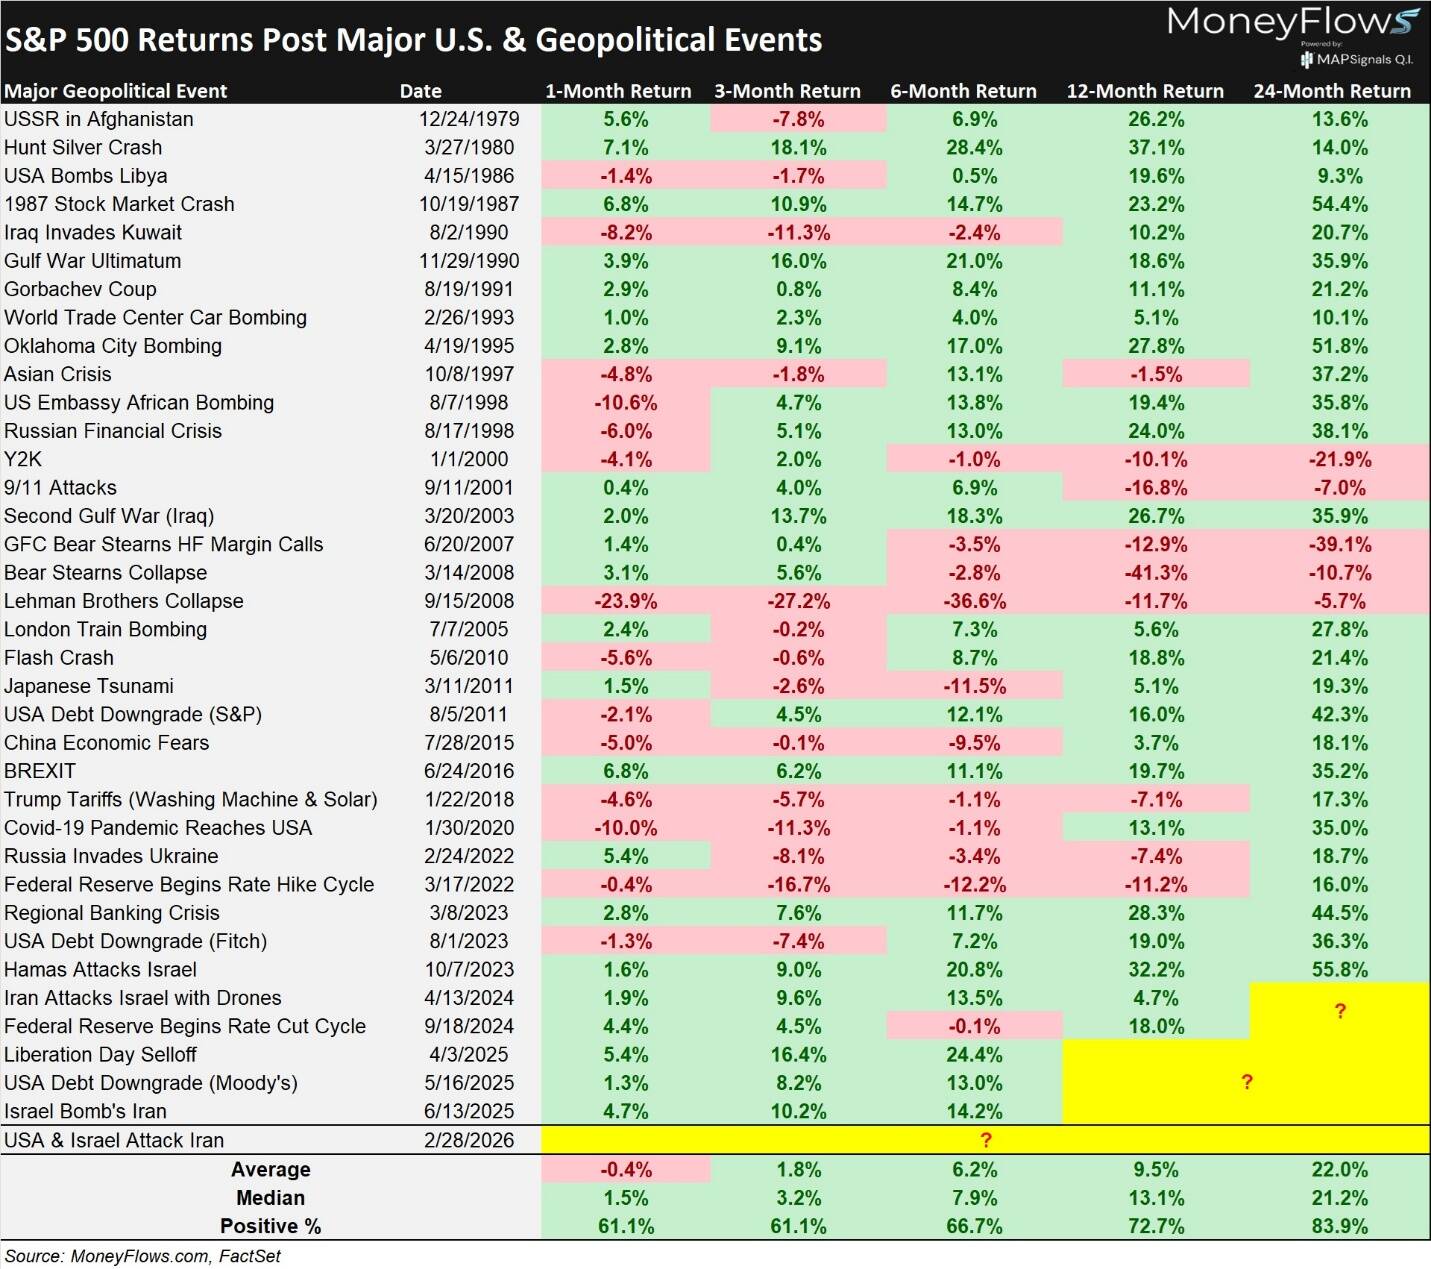
If you move to cash, you miss out on everything in that table.
Yes, you’d be glad to miss the losses. But the averages are clear: if you want to achieve gains, you must be ready to weather some storms.
It’s Paid to Buy Stocks
It may seem easier to take a long view when you’re not in the thick of volatility. And we are in the thick of it – the CBOE Volatility Index (VIX) hasn’t seen these levels in months:
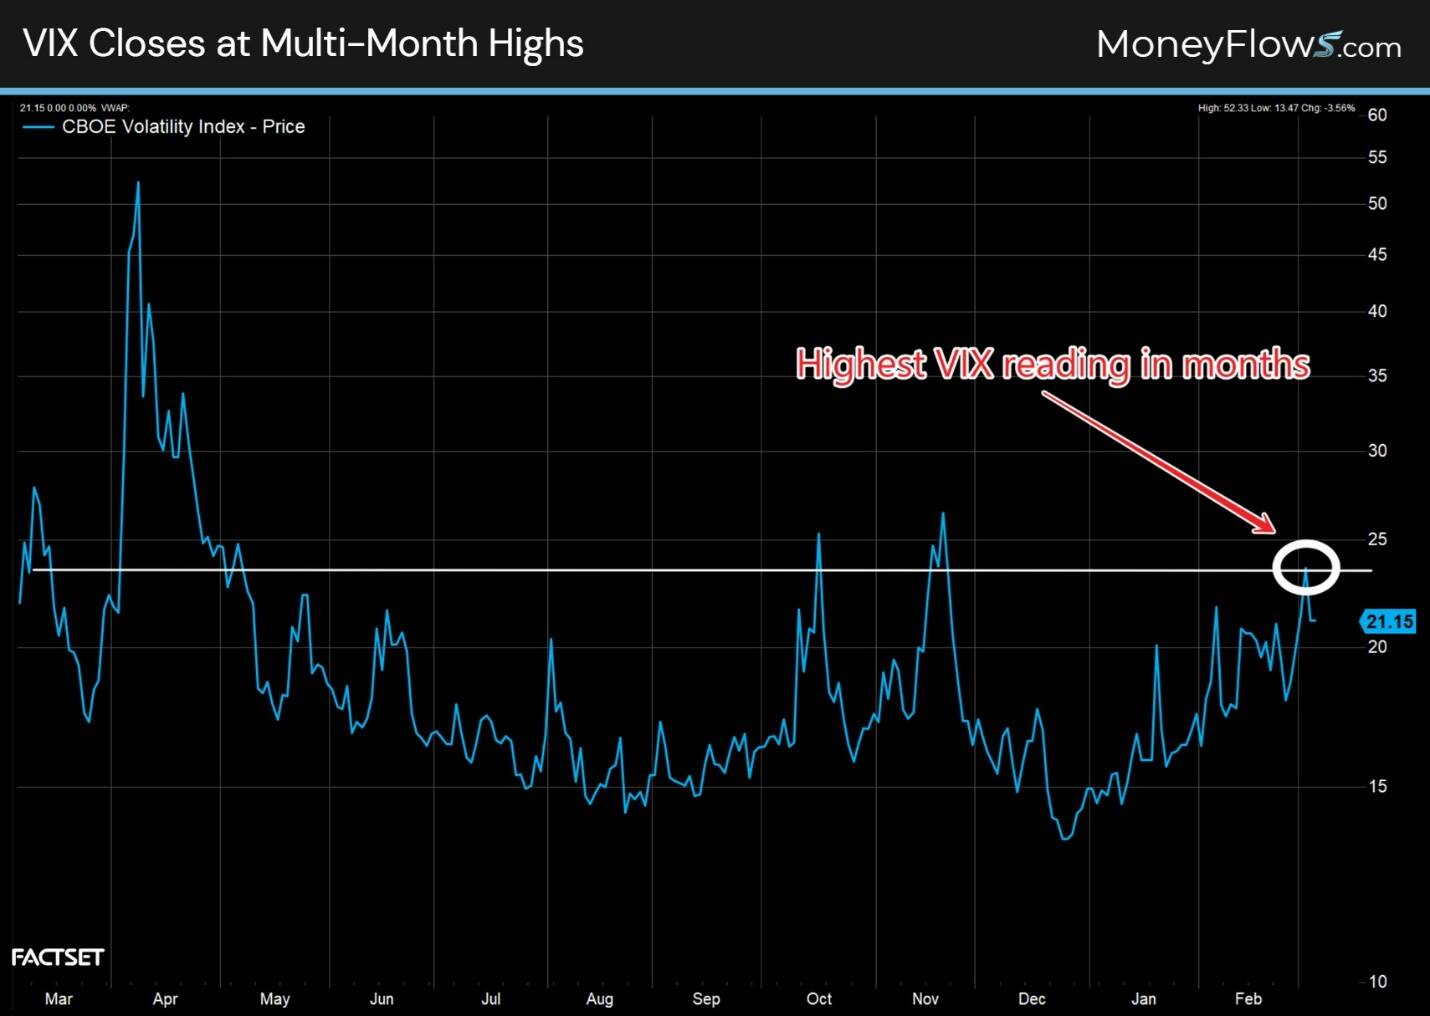
When the VIX shoots higher, stocks drop quickly. This again would seem like a time to seek the safety of cash.
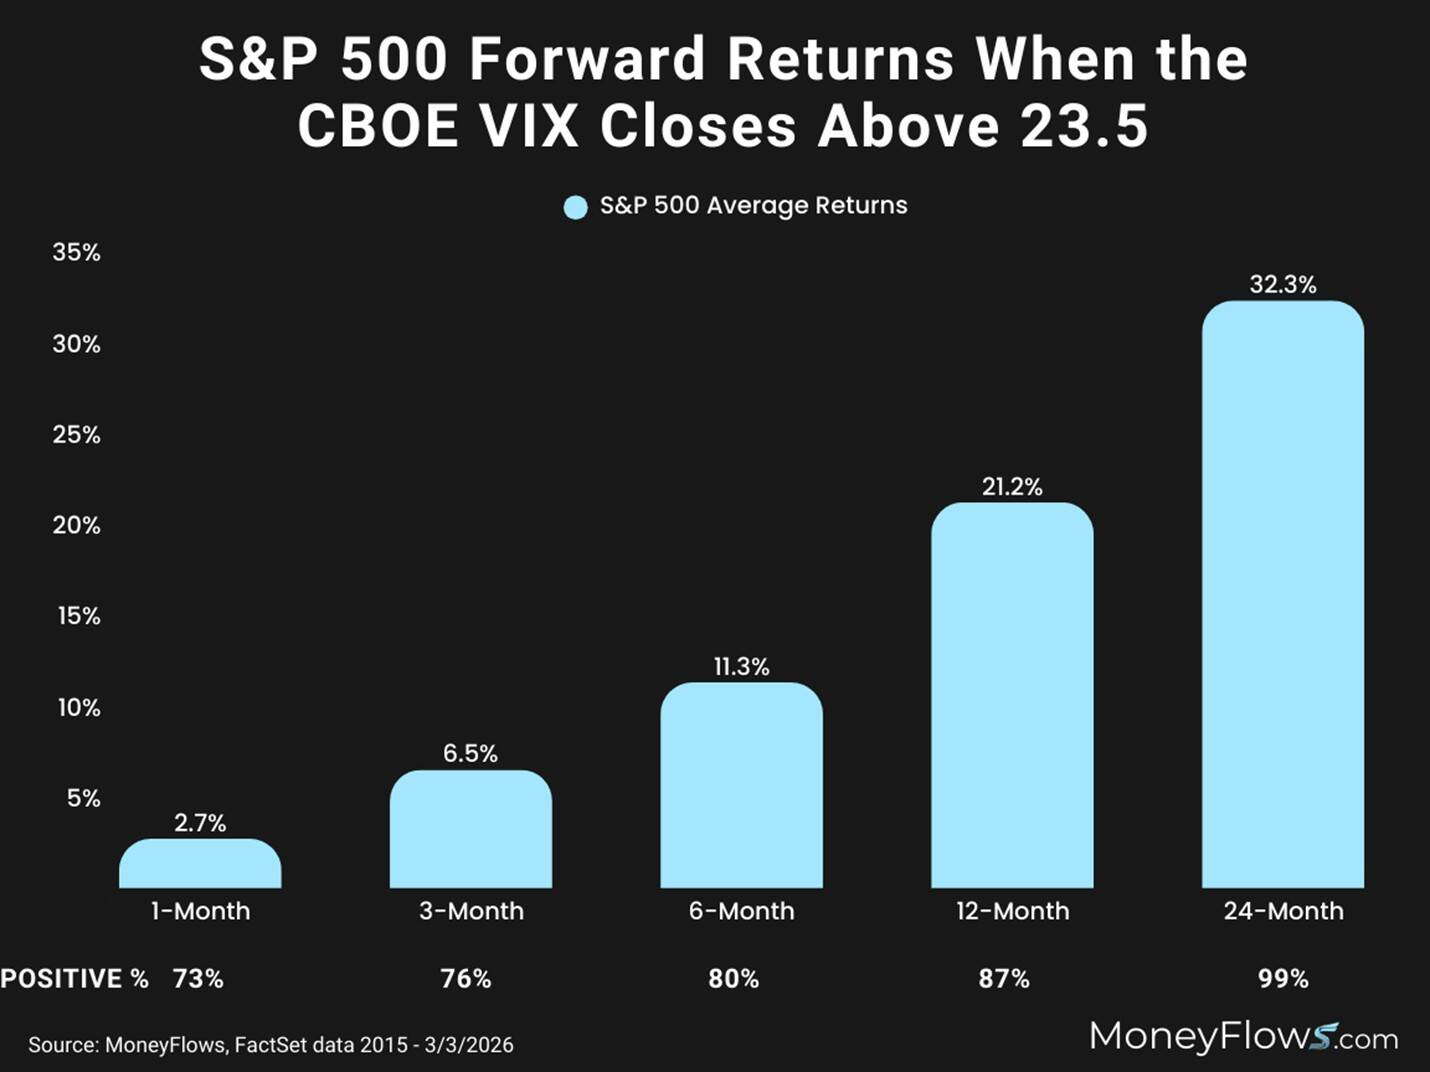
But, since 2015 when the VIX closes above 23.5, it’s paid to buy stocks:
- One-month return: 2.7%
- Three-month return: 6.5%
- Six-month return: 11.3%
- 12-month return: 21.2%
- 24-month return: 32.3%
If you want to “buy low,” it often happens during times of uncertainty. But it’s worth it:
When volatility is high, it’s a great time to seek dividend growth stocks. Not only are they typically businesses that are built for resilience, they also generate cash, which means income for investors.
Right now, there are two shining examples of dividend growth excellence in MoneyFlows data. The first is Archrock, Inc. (AROC), a natural gas industrial supplier with a market cap of $6.5 billion.
Note the continual increases in dividend payouts:
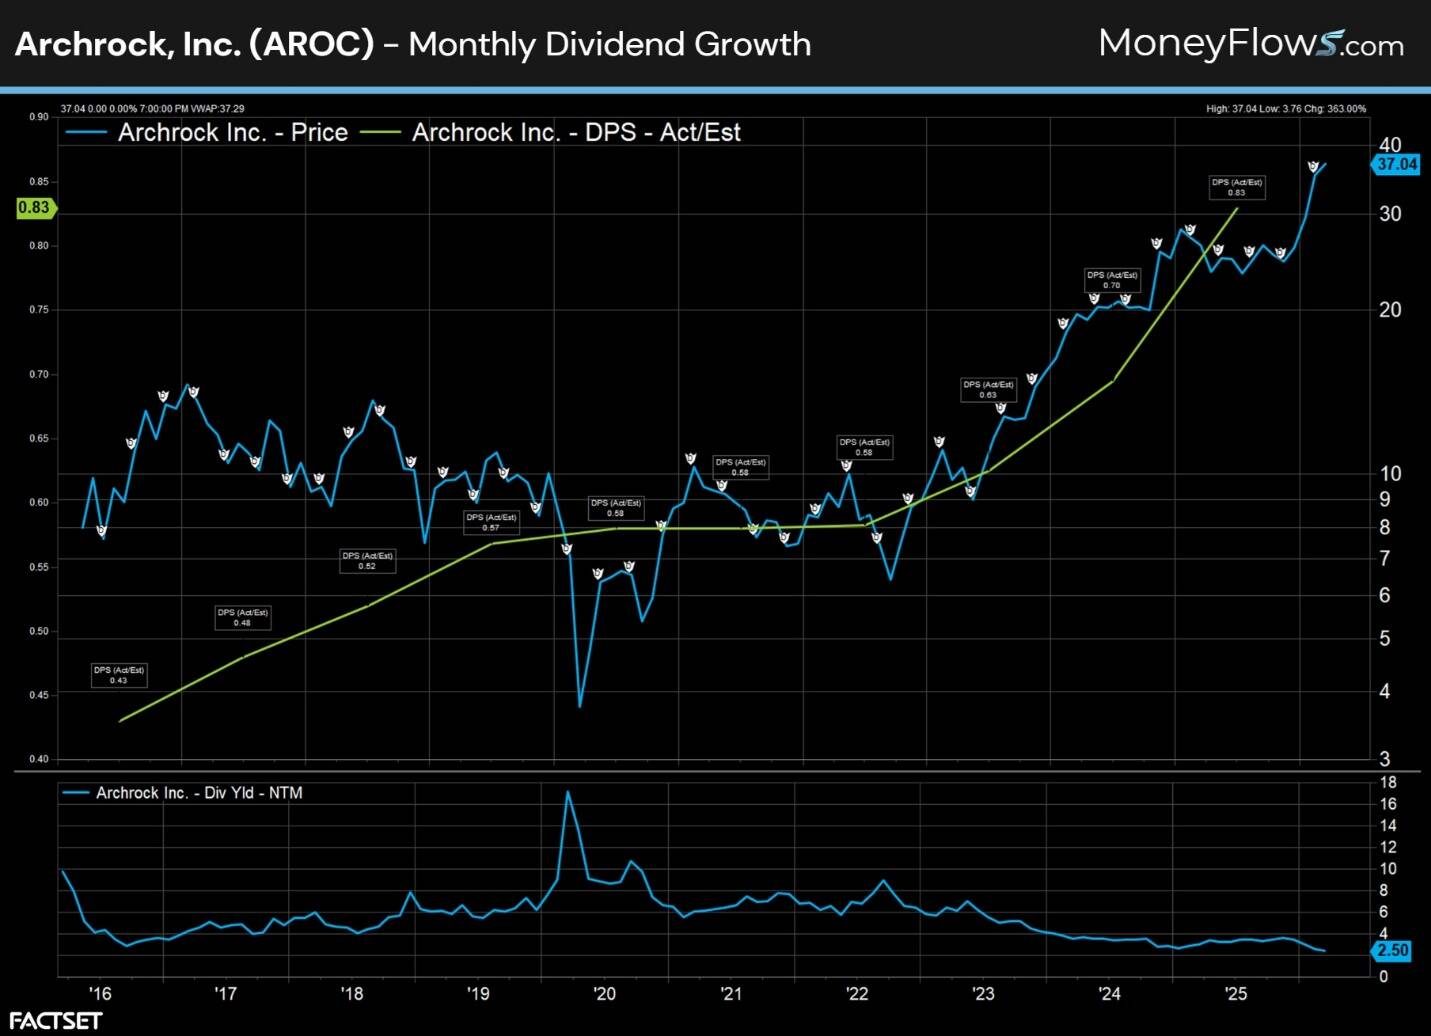
At last measure the forward yield stands at 2.5%.
Another dividend growth star is Diamondback Energy, Inc. (FANG), an oil and gas developer with a $50 billion market cap.
The current forward yield for FANG sits at 2.47%. And for the last six months, it’s been nothing but inflows:
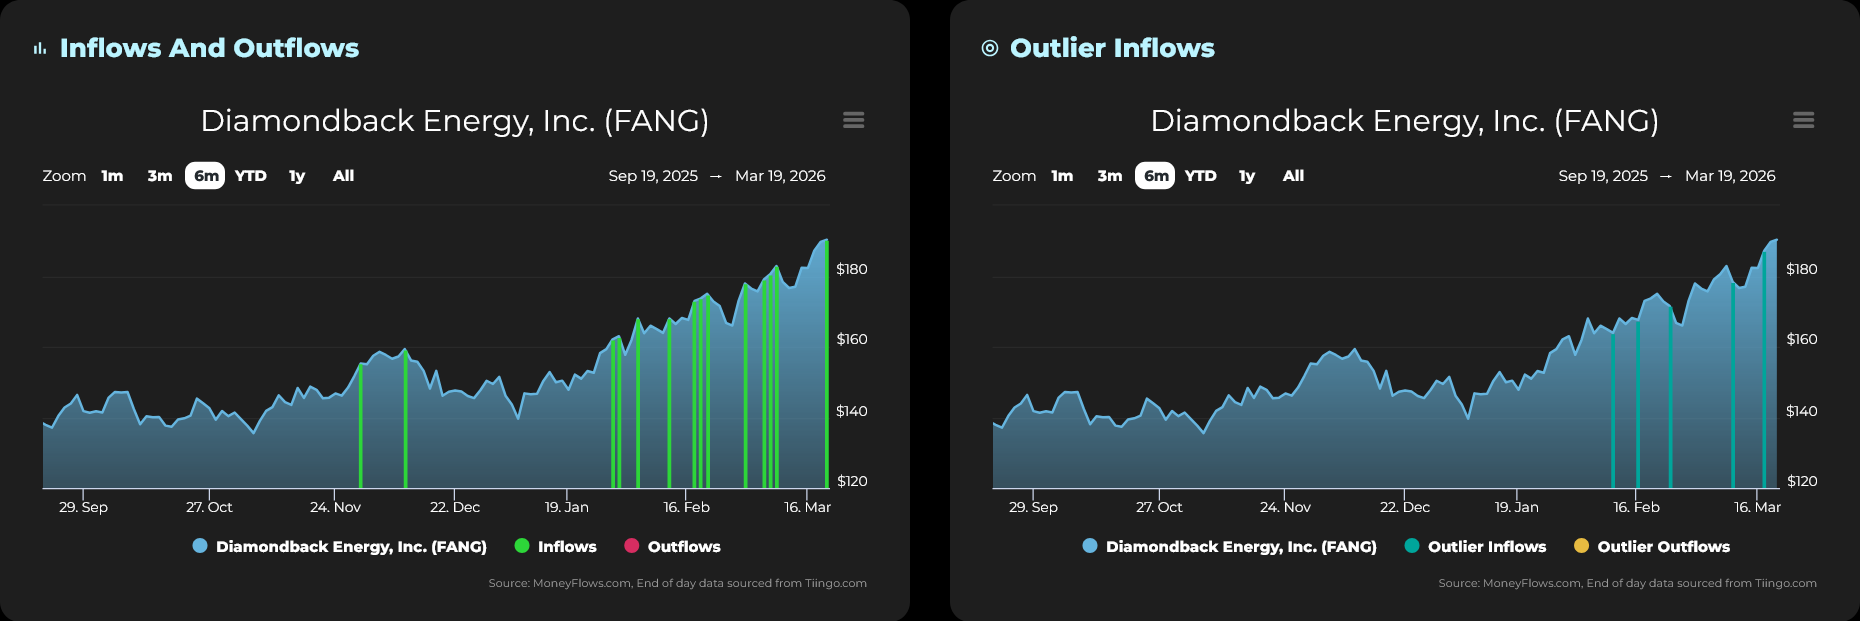
Energy stocks generally have been in favor due to the current global situation.
So, it’s not a surprise that Big Money is behind some of the huge upward market moves.
Stocks Tend to Recover
Don’t overreact to geopolitics, even when market volatility spikes, because stocks tend to recover.
Consider high-quality dividend growth stocks as a viable alternative to the chaos. As you saw, cash is not the long-term safe play.
If you are a Registered Investment Advisor (RIA) or a serious investor, take your investing to the next level and follow our free weekly MoneyFlows insights.
Disclosure: the author holds no positions in AROC or FANG at the time of publication.


