
Advertisement
Advertisement
Technical Outlook Of Gold, Silver & US Dollar Index: 26.10.2017
By:
GOLD Following its failure to sustain $1300 break, the Gold prices are now declining towards testing the 200-day SMA level of $1259 ahead of the crucial
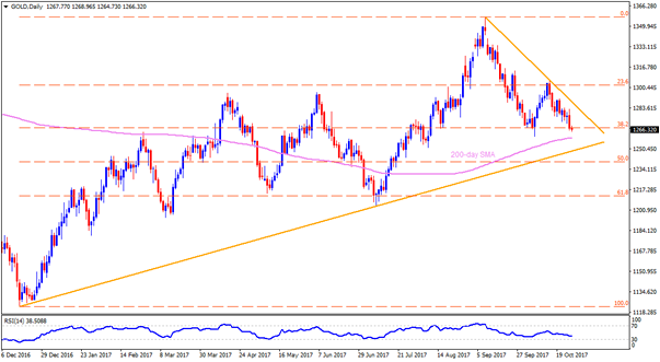
GOLD
Following its failure to sustain $1300 break, the Gold prices are now declining towards testing the 200-day SMA level of $1259 ahead of the crucial US GDP release. Given the upbeat growth figure drags the yellow metal beneath $1259 on a daily closing basis, ten-month old ascending trend-line support of $1248 might confine its further downside, which if not respected could open the door for the bullion’s plunge in direction to $1235 & $1228. Alternatively, a day’s close beyond $1273 may trigger the Gold’s pullback to $1283 and then the downward slanting TL figure of $1288, breaking which it can rise to $1296 and the $1305 resistances. In case of the quote’s sustained trading above $1305, the $1314, the $1322 and the $1333 are likely consecutive north-side numbers to appear on the chart.
SILVER
Even after almost clearing the $16.70 TL support, Silver might find it difficult to break the $16.59 support-line, which if conquered can fetch it to $16.50 and then to the $16.30 rest-points. Should the downside pressure breaks $16.30 mark, the $16.00 and the $15.70 can become sellers’ favorite. Meanwhile, $16.90 and the $17.05 may entertain short-term buyers during the metal’s pullback, breaking which 50-day SMA level of $17.195 and the $17.235 trend-line resistance gain importance. If at all the Silver surpasses $17.235 at a daily close, $17.40 & $17.60 could please the Bulls.
US Dollar Index [I.USDX]
With a successful clearance of 94.10-15 horizontal-line, the US Dollar Index (I.USDX) is trading beyond 100-day SMA for the first time in more than seven-months; however, the gauge’s further upside is likely to be challenged by the resistance-line of near-term ascending trend-channel, at 95.35. Given the index’s ability to conquer 95.35 resistance, the 95.55, the 96.20 and the 96.50 might offer intermediate halts during its upward trajectory towards 200-day SMA level of 96.90. On the downside, 94.60 and 94.30 are expected nearby supports that can be availed if the profit-booking takes place after US GDP release. Suppose the sellers continue dominating the index after 94.30, the 94.10-15 area gains the lime-light, break of which may again fetch it to 93.60 and then to the channel-support of 93.40. Moreover, the greenback indicator’s downturn beneath 93.40 can drag it to the 92.70 support-mark.
Cheers and Safe Trading,
Anil Panchal
About the Author
Anil Panchalauthor
An MBA (Finance) degree holder with more than five years of experience in tracking the global Forex market. His expertise lies in fundamental analysis but he does not give up on technical aspects in order to identify profitable trade opportunities.


Advertisement