
Advertisement
Advertisement
Technical Outlook Of Gold, Silver & WTI Crude Oil: 10.11.2017
By:
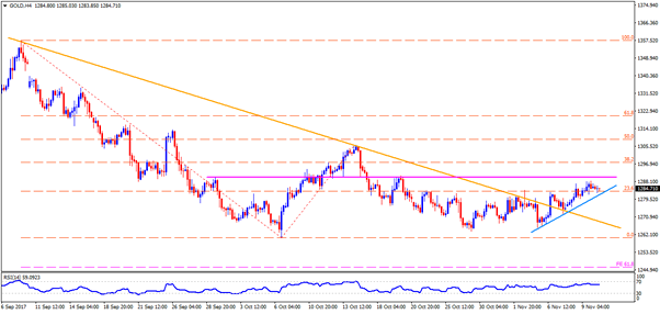
GOLD With the Gold’s recovery from $1265.50 stretching well beyond two-month old descending trend-line, chances of its further up-moves become brighter;
GOLD
With the Gold’s recovery from $1265.50 stretching well beyond two-month old descending trend-line, chances of its further up-moves become brighter; however, the $1290-91 horizontal-line is likely restricting the yellow metal’s immediate advances. Given the Bullion’s ability to surpass the $1291 mark, the $1298 and the $1306 can act as intermediate halts ahead of highlighting the importance of $1314 and the $1320-21 resistances. On the downside, an upward slanting TL figure of $1281 seems nearby stop during the metal’s pullback, breaking which it can quickly drop to the $1277 & the $1271 supports prior to registering $1265.50 again on the chart. Following the break of $1265.50, the $1261-60 and the 61.8% FE level of $1246 might be targeted by the sellers.
SILVER
Even if the resistance-line of a short-term symmetrical triangle triggered the Silver’s pullback, the $16.90 support-mark reversed the action and is presently favoring the white-metal’s another attempt to challenge the formation’s upper-line, at $17.22 now. If the quote clears the $17.22 barrier, the $17.33, the $17.50 and the $17.60 may entertain buyers before pleasing them with the $17.85 and the $18.00 numbers to north. Alternatively, break of $16.90 can drag the prices to $16.78 support-line, which if broken could extend the downturn to $16.60 and then to the $16.53-52 horizontal-area. Should the metal declines beneath $16.52, it becomes vulnerable to revisit the October low, around $16.30.
WTI CRUDE OIL
Even if the WTI Crude witnessed pullback moves from $57.80, the energy prices aren’t expected to plunge unless closing below $54.60 on a D1 basis; though, more than a year-long ascending trend-line, coupled with 61.8% FE level, may confine the quote’s near-term advances around $58.40-50 region. Presently, the Crude’s up-moves from $56.30 may aim for $57.50 and then to the $58.00 ahead of portraying another confrontation to $58.40-50 region. In case if Bulls manage to cross $58.50 on a daily closing basis, it seems wise to look for $60.00 while being long. Meanwhile, the $56.30, the $55.50 and the $55.00 can offer adjacent supports to the Crude, breaking which the $54.60 becomes crucial for traders. Given the successful break of $54.60, the $53.70, the $53.30 and the $52.50 could appear in sellers’ radar.
Cheers and Safe Trading,
Anil Panchal
About the Author
Anil Panchalauthor
An MBA (Finance) degree holder with more than five years of experience in tracking the global Forex market. His expertise lies in fundamental analysis but he does not give up on technical aspects in order to identify profitable trade opportunities.


Advertisement